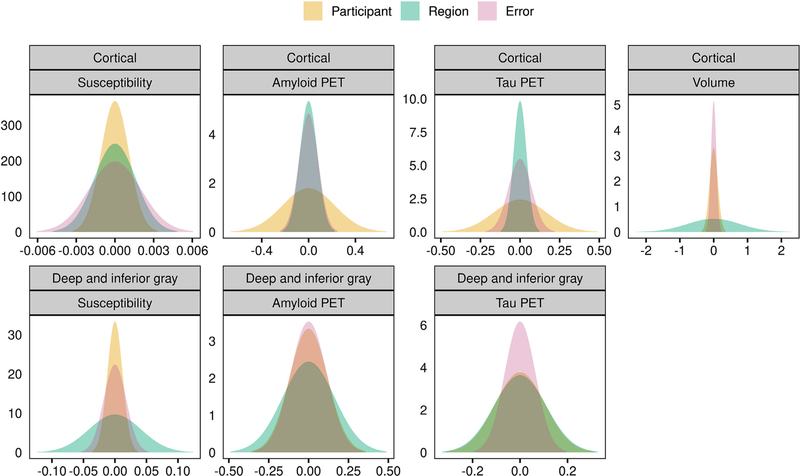
Fig. 2.
Normal densities reflecting the estimated SDs from the variance components analysis for susceptibility, amyloid PET SUVR, tau PET SUVR, and cortical gray matter volume. Analysis was performed using the unnormalized susceptibility measures and PET and volume measures were log-transformed. Results are shown separately for cortical (top row) and deep and inferior gray nuclei (bottom row). The x-axis differs among plots and is representative of spread or variation in values. The y-axis represents amplitude with values based on the SD of each measure such that the area under the curve is equal to 1.

