
Figure 2. Maintaining detection sensitivity in Detection of Amplification by Releasing of Quenching loop-mediated isothermal amplification.
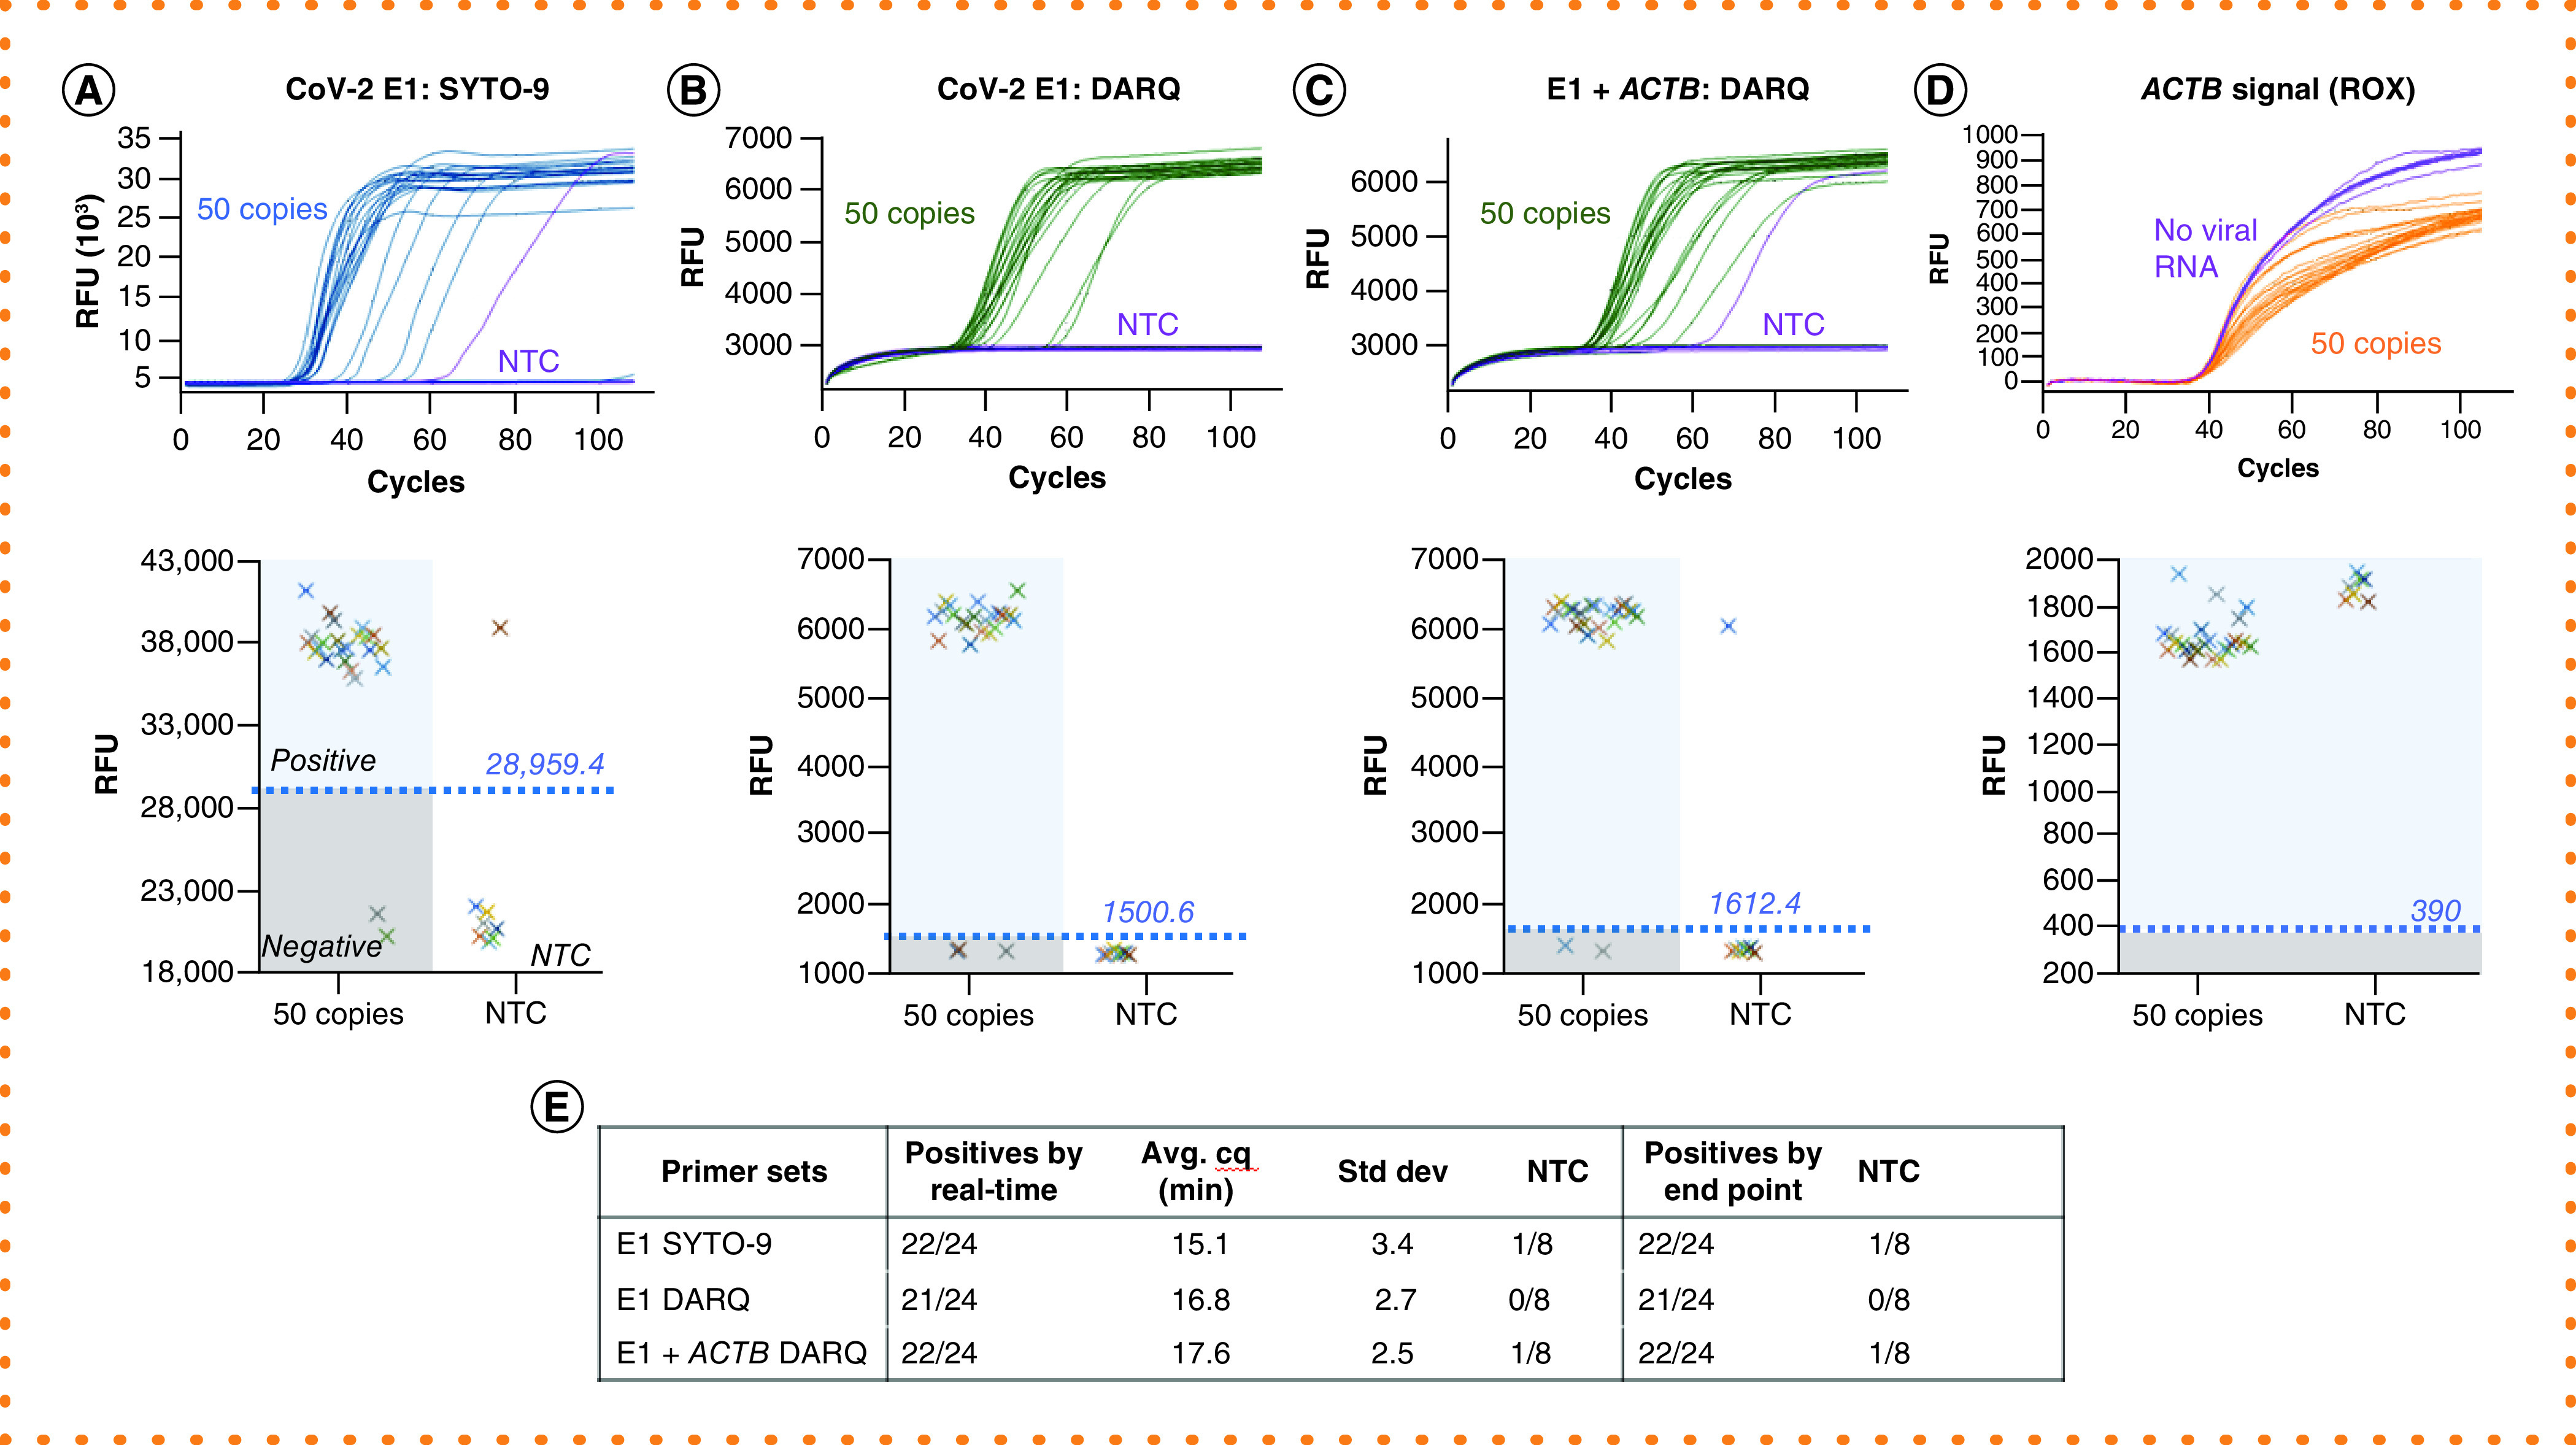
Amplifications were performed with 24 repeats, each containing 50 copies of SARS-CoV-2 RNA, or 8 repeats of NTC, using E1 or both E1 and ACTB primer sets. Two methods were used to determine positive amplification, and their results are arranged in the same panel: real-time curves (top) and plots of RFU obtained from end point scanning (bottom). In the RFU plotting, the threshold (value shown above the line) for positive reactions and a separation from NTC reactions divide the plot area into four quadrants as illustrated in panel A: positives, negatives, false positives and NTC. (A) Detection by SYTO-9. (B) Single-plex DARQ LAMP. (C) Duplex DARQ LAMP including both E1 and ACTB primers. (D) ACTB detection from duplex DARQ LAMP. (E) Summary of detection. Total number of positives, amplification speed (Cq) and correlation of results by real-time curve and end point scanning.
DARQ: Detection of Amplification by Releasing of Quenching; LAMP: Loop-mediated isothermal amplification; NTC: No-template control; RFU: Raw fluorescence unit.