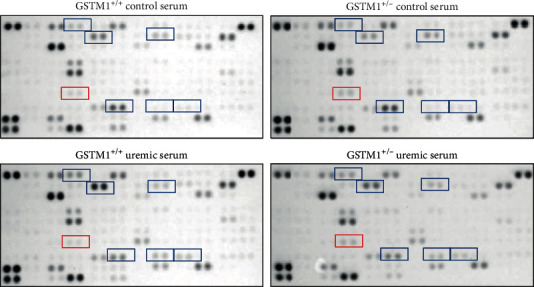
Figure 2.

Proteome Profiler Human XL Cytokine Array and original blots. Cytokines that exhibited ≥2-fold change in uremic serum when compared to control serum treatment are marked blue (vertical comparison between images). Cytokines that exhibited ≥2-fold change in GSTM1+/- cells when compared to GSTM1+/+ are marked red (horizontal comparison between images).
