FIGURE 7.
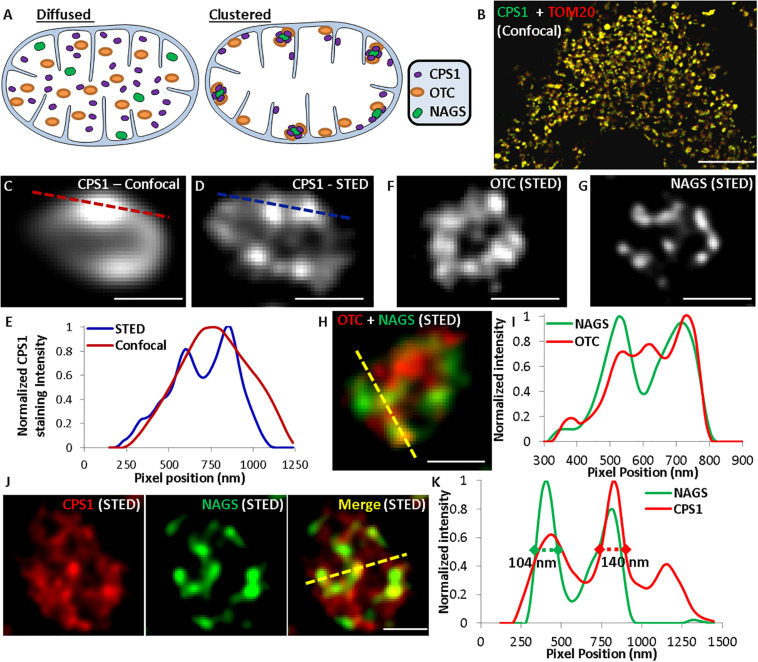
Use of super-resolution microscopy to determine in situ nanoscale organization of urea cycle enzymes. (A) Schematic representing the possible distribution of urea cycle enzymes in the mitochondria. (B) Confocal images showing localization of CPS1 and the mitochondrial protein TOM20 labeled with Alexa Fluor 532 and Alexa Fluor 647, respectively. (C) Confocal and (D,F,G) gSTED images showing individual mitochondria in mouse hepatocytes immuno-stained for (C,D) CPS1, (F) OTC, (G) NAGS, (H) OTC (Alexa Fluor 647) and NAGS (Alexa Fluor 532), (J) CPS1 (Alexa Fluor 647) and NAGS (Alexa Fluor 532). Single labeling in images (C,D,F,G) was done with Alexa Fluor 647. (E,I,K) Normalized pixel intensity plot for the dotted lines marked in the corresponding confocal or STED images.

