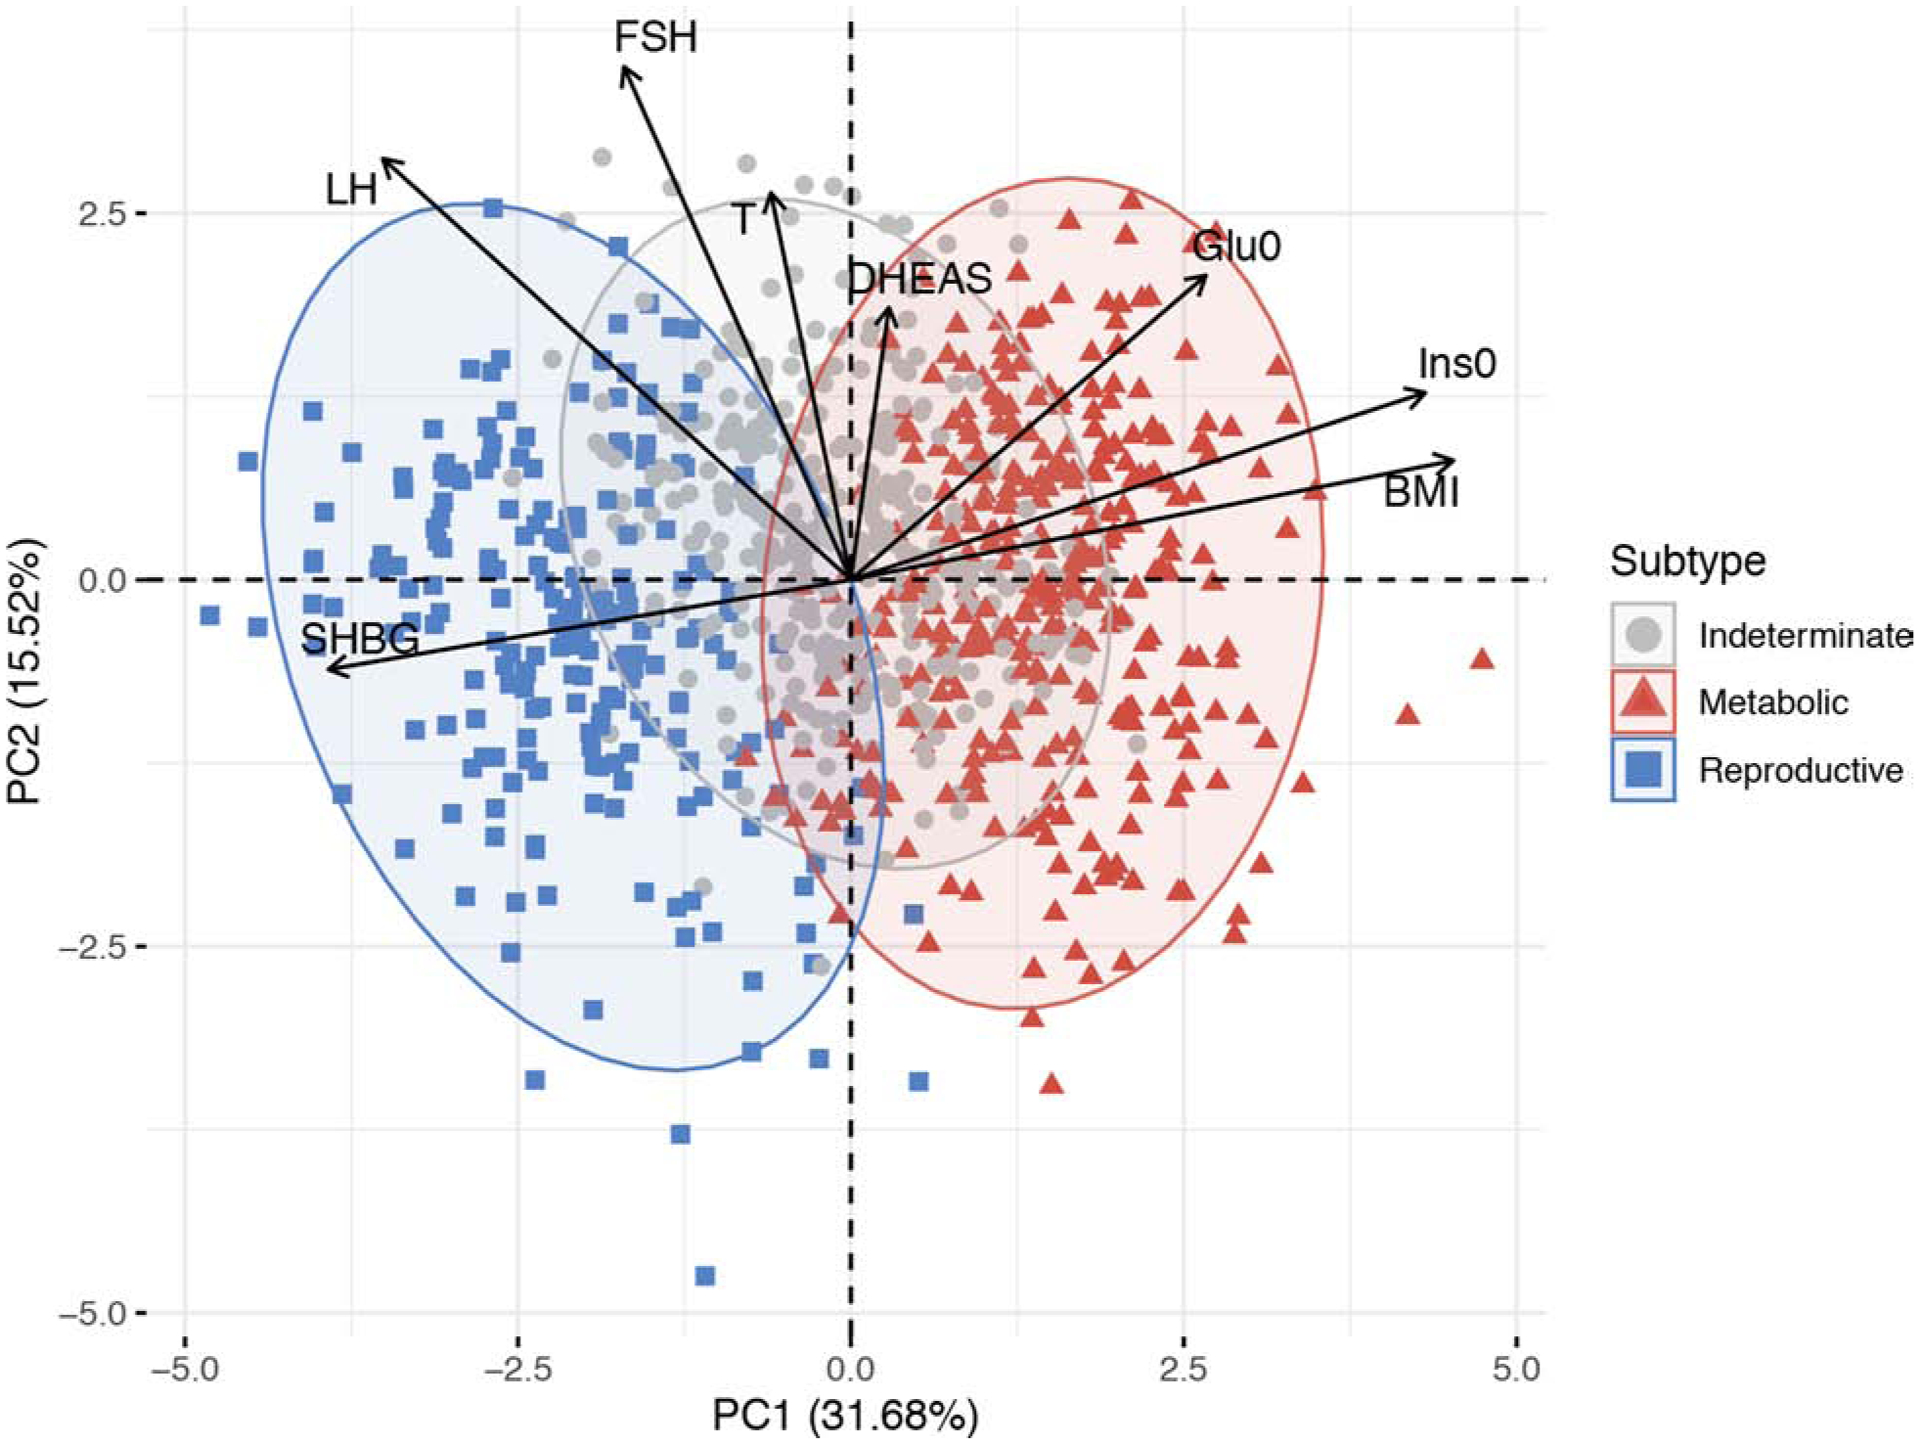
Figure 2: Principal component analysis plot of quantitative traits for a genotyped PCOS clustering cohort showing a biologically driven method of PCOS classification.

Women with PCOS were clustered into distinct groups—metabolic, reproductive, and indeterminate—based on BMI, fasting insulin, fasting glucose, DHEAS, T, FSH, LH, SHBG, and genotype data. The relative magnitude and direction of trait correlations with the principal components are shown with black arrows. PC=principal component; Ins0= fasting insulin; Glu0= fasting glucose.
(From Dapas M, Lin FTJ, Nadkarni GN, et al. Distinct subtypes of polycystic ovary syndrome with novel genetic associations: An unsupervised, phenotypic clustering analysis. PLoS Med. 2020;17(6):e1003132; with permission.)
