FIG 3.
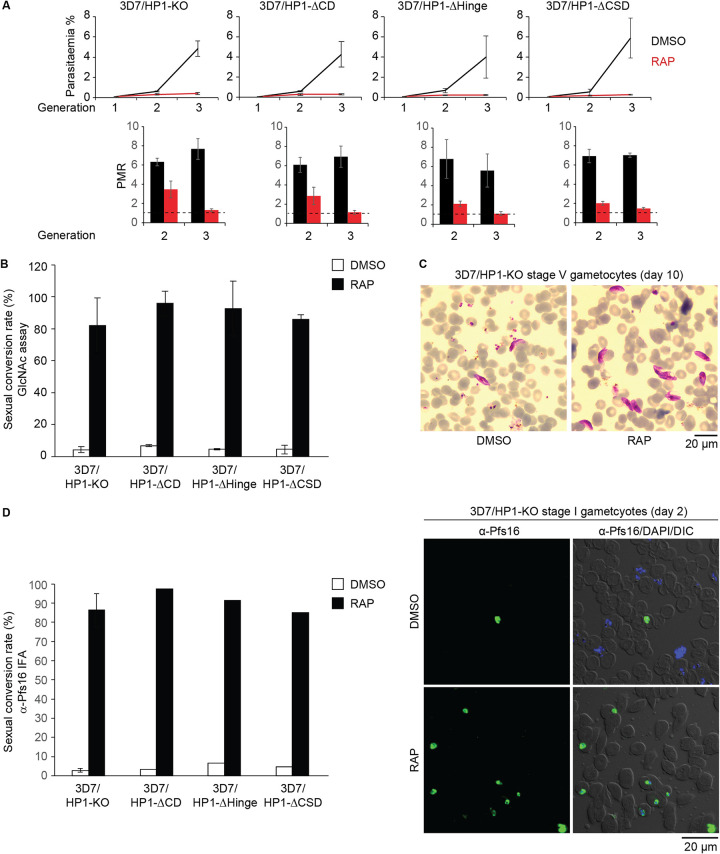
Phenotypes of PfHP1 truncation mutants. (A, top) Growth curves of the DMSO- and RAP-treated PfHP1 truncation mutants over three consecutive generations. (Bottom) Parasite multiplication rates (PMRs) reflect the fold increase in parasitemia observed in generations 2 and 3. Values are the means of results from three biological replicates (error bars indicate SD). For each sample, >3,000 RBCs were counted. (B) Sexual conversion rates of PfHP1 truncation mutants in DMSO- and RAP-treated parasites, assessed by inspection of Giemsa-stained blood smears of GlcNAc-treated cultures on day 6 of gametocytogenesis. Results are the means of results from at least three replicates (error bars indicate SD). For each sample, >3,000 RBCs were counted. (C) Representative overview images from Giemsa-stained blood smears showing stage V gametocytes (day 10 of gametocytogenesis) obtained from DMSO- and RAP-treated 3D7/HP1-KO parasites. Scale bar, 20 μm. (D) Sexual conversion rates of PfHP1 truncation mutants in DMSO- and RAP-treated parasites, assessed by anti-Pfs16 IFAs performed on stage I gametocytes on day 2 of gametocytogenesis. The result from the 3D7/HP1-KO line represents the mean of results from four replicates (error bar indicates SD). All other values derive from a single experiment. For each sample, >200 iRBCs were counted. Representative overview images of anti-Pfs16 IFAs used to quantify stage I gametocytes in DMSO- and RAP-treated populations of the 3D7/HP1-KO line are shown on the right. Scale bar, 20 μm.

