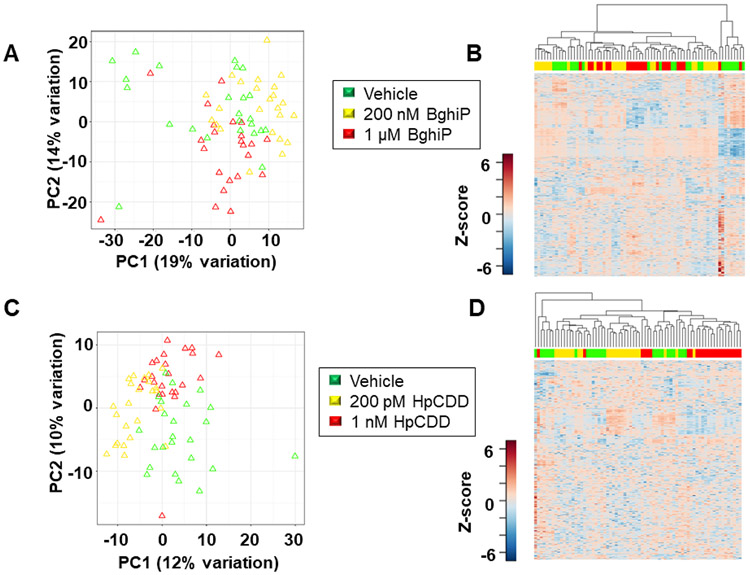
FIGURE 2.
Metabolic dose responses associated with exposure to BghiP and HpCDD. A, Unsupervised HCA-heatmap indicates that intensity of 720 metabolites drive the separation between the vehicle, 200 nM BghiP and 1 μM BghiP exposure. B, PCA plot showing separation of the vehicle (green) 200 nM BghiP (yellow) and 1 μM BghiP (red), through the 1st (19% variation) and 2nd (14% variation) principal components. C, Unsupervised HCA-heatmap indicates that intensity of 388 metabolites drive the separation between the vehicle, 200 pM HpCDD and 1 nM HpCDD exposure. D, PCA plot showing separation of the vehicle (green) 200 pM HpCDD (yellow) and 1 nM HpCDD (red), through the 1st (12% variation) and 2nd (10% variation) principal components. n=23 (BghiP 1 μM); n=24 (BghiP 200nM, vehicle, 200 pM HpCDD, and 1 nM HpCDD).

