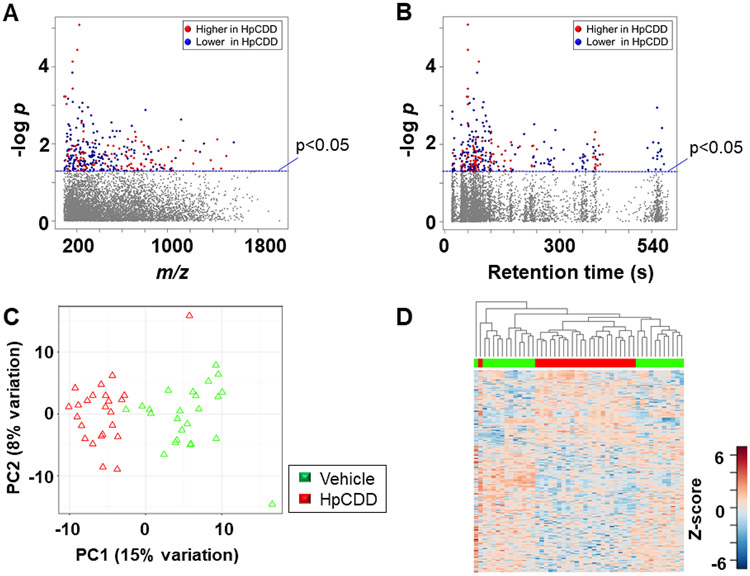
Figure 5.
Metabolic responses associated with exposure to 1 nM HpCDD. A, Type I Manhattan plot of metabolites plotted against the –log p value indicates that features are altered after exposure to HpCDD at p < 0.05; 108 metabolites increased after HpCDD exposure (red) while 191 were decreased (blue); 6003 features were not affected by HpCDD exposure (gray) (6030 m/z features) were not affected by exposure. B, Type II Manhattan plot using retention time (RT, s) plotted against –log p value. n=24 for both conditions. C, PCA plot showing separation of the vehicle treated (green) and 1 μM HpCDD exposed (red), through the 1st (15% variation) and 2nd (8% variation) principal components. D, Unsupervised HCA-heatmap indicates that intensity of 299 metabolites drive the separation between the vehicle treated and HpCDD treated cells.

