Figure 2.

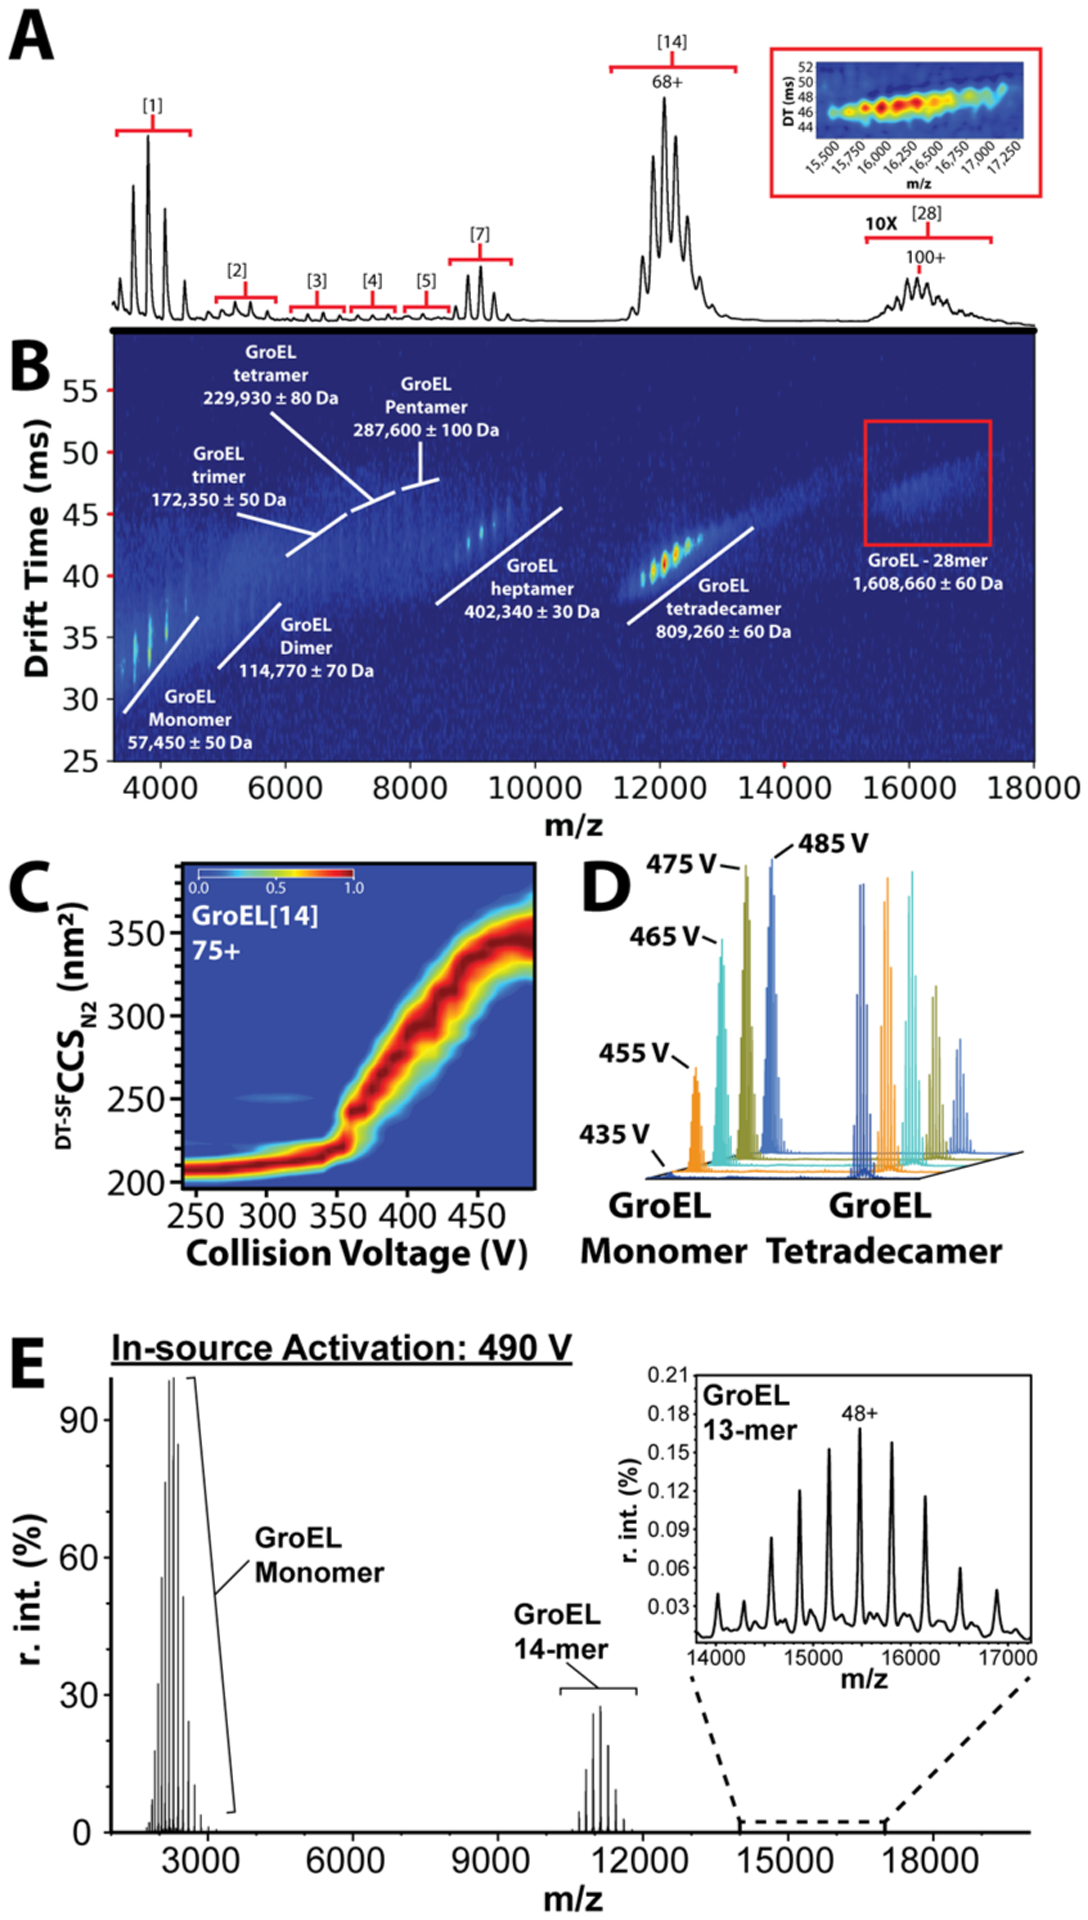
Native MS and CIU of E. coli GroEL: (A) native mass spectrum of chaperonin 60 from E. coli (groEL). Charge state distributions of 1-, 2-, 3-, 4-, 5-, 7-, 14-, and 28-mer complexes of GroEL are labeled (bracketed numbers). The signal intensity for the 28-mer complex is magnified 10x. The inset shows an enlarged IMMS plot of the 28-mer complex. (B) Corresponding IM-MS plot of GroEL with complexes labeled. (C) CIU of the 75+ charge state of GroEL. (D) Stacked mass spectra that show CID of GroEL 14-mer as in-source activation is increased (collision voltages labeled). Spectral intensity values are normalized relative to the most intense signal per collision voltage step. (E) Extracted mass spectrum of GroEL 14-mer CID products at 490 V in-source activation, demonstrating the stability of the 14-mer complex, and the presence of the stripped 13-mer complex (48+ charge state labeled).
