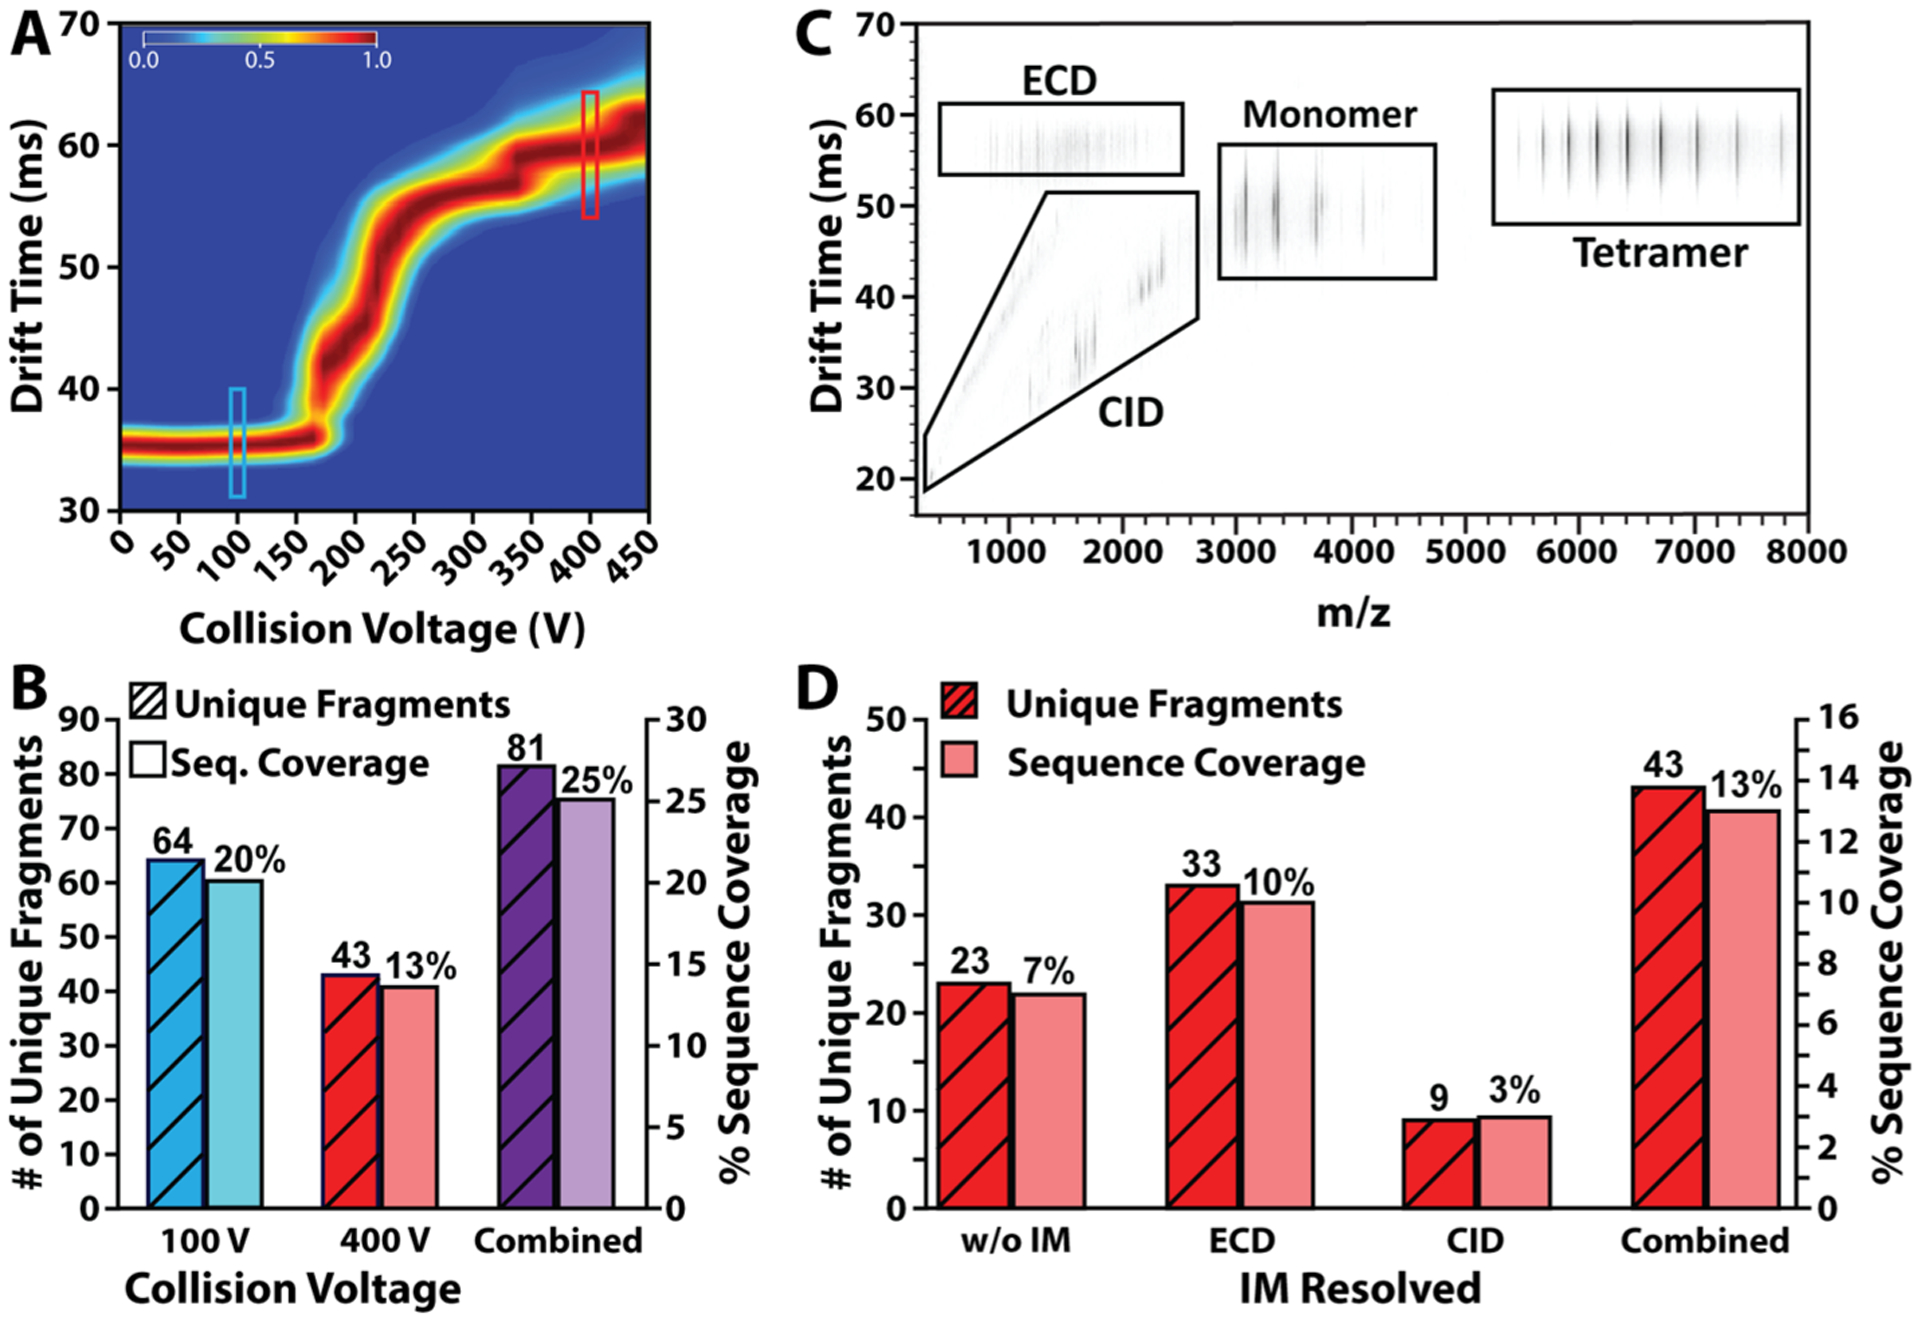
Figure 4.

IM-ECD of alcohol dehydrodgenase. (A) All ion CIU fingerprint of ADH 23+ to 26+ charge states. CIU fingerprints of the 23+, 24+, 25+, and 26+ charge states are combined into one fingerprint representative of all ions unfolding in parallel, since all ions undergo ECD simultaneously. Turquoise box marks 100 V; red box marks 400 V. (B) Histogram showing number of unique fragments and sequence coverage for each collision voltage sampled for ADH. The colors correspond to the regions indicated in the CIU fingerprint in (A). (C) IM-MS spectrum of ADH IM-ECD with 400 V in-source activation. (D) Histogram showing a number of unique fragments and sequence coverage for collision voltage of 400 V without and without IM separation. The combination of both fragmentation techniques is also shown.
