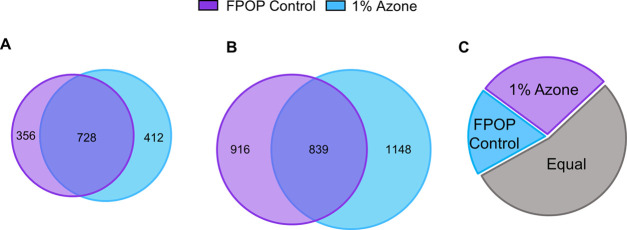
Figure 4.
IV-FPOP oxidatively modified proteins and peptides. (A) Oxidatively modified proteins using 200 mM hydrogen peroxide in the presence and absence of 1% AZ. (B) Oxidatively modified peptides using 200 mM hydrogen peroxide in the presence and absence of 1% AZ. (C) Pie chart of oxidatively modified peptides per single protein. Purple represents the number of proteins that show more oxidatively modified peptides per protein using 1% AZ (28%). Blue represents the number of proteins that show more oxidatively modified peptides per protein in the absence of 1% AZ (18%). Gray is the number of proteins with equal oxidatively modified peptides per protein in both conditions (54%).

