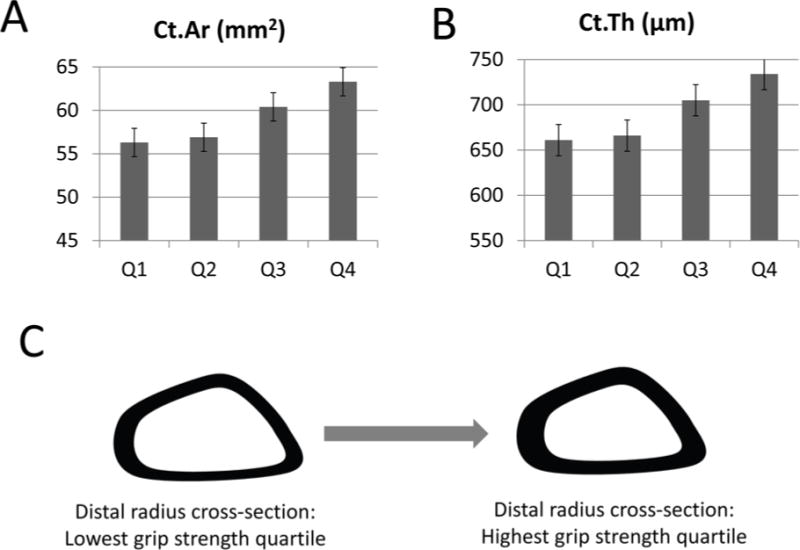
Figure 1.

Graphs showing measures of cortical area (A; p<0.001 ANOVA) and cortical thickness (B; p<0.05 ANOVA) in men with grip strength values in the lowest (Q1) and highest (Q4) quartiles. Data from ref. [20]. C. Schematic showing the significant differences in bone cross-sectional shape of the radius among men in the lowest and highest quartiles of grip strength.
