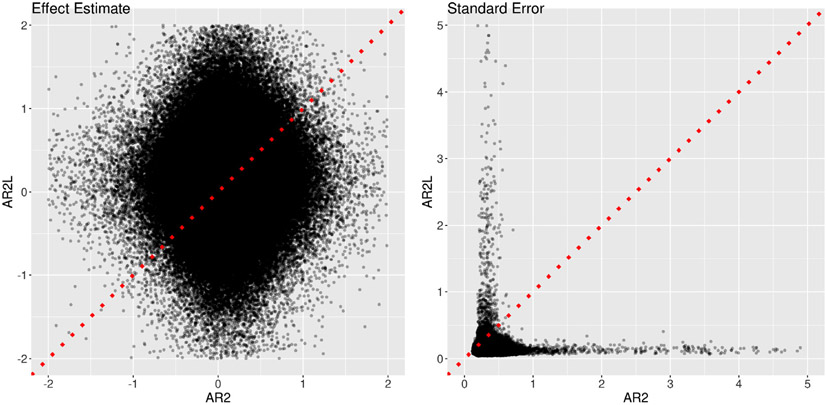
Fig. 14.
Comparisons of two approaches in AR handling. Two models were adopted to fit the data at the 11 ROIs, one (x-axis: AR2) with the GLS model (1)plus an AR(2) structure and the other (y-axis: AR2L) with the model (21)that mimicked the approach by Westfall et al. (2017). The effect estimates (left) and their standard errors (right) are shown for the total trial-level effects among the two cues and four tasks. The substantial amount of deviation of the effect estimates from the diagonal line (dotted red) indicates the dramatic differences between the two models. The precision underestimation of the model with lagged effects (AR2L) can be assessed by the proportion of data points (98.3%) below the dotted red line.

