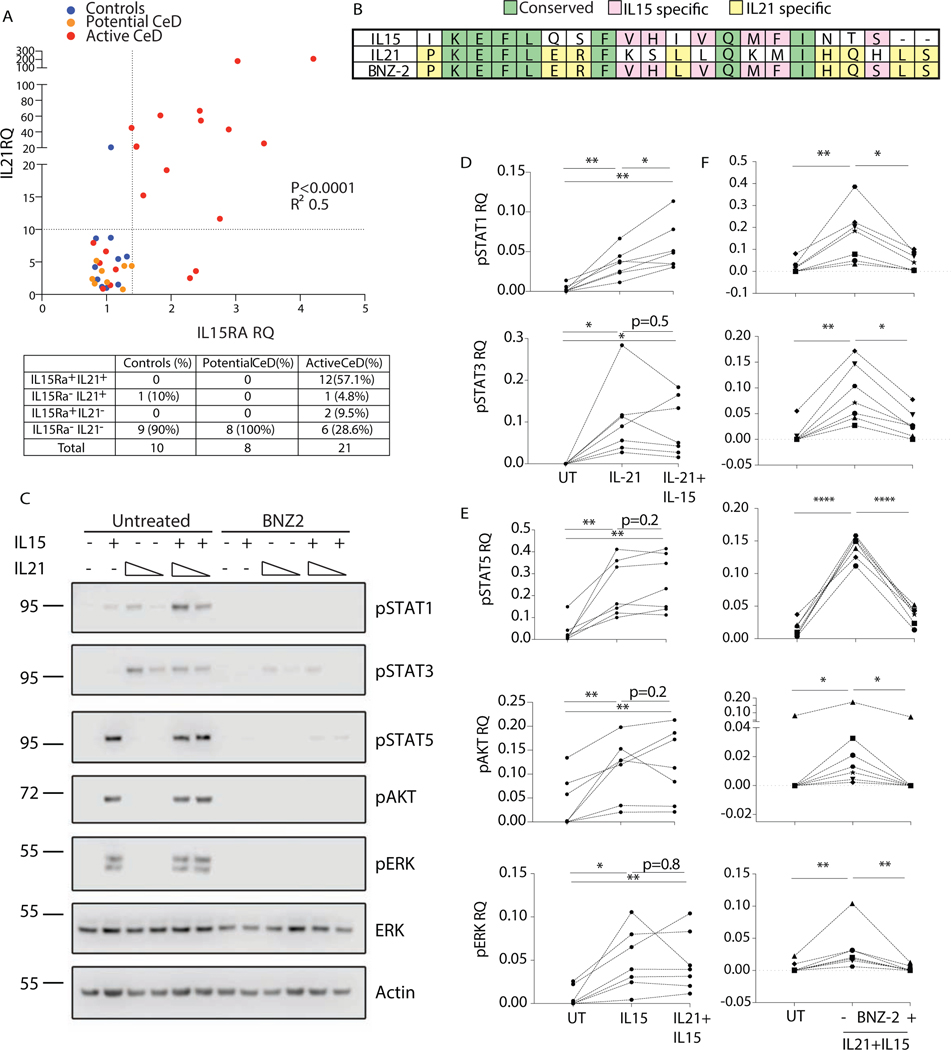
Figure 1. IL15 and IL21 are concomitantly up-regulated in full-blown celiac disease and BNZ-2 impairs their cooperative signaling in human tissue-resident IE-CTL.
(A) Relative quantification (RQ) of IL15 receptor alpha (IL15RA) and IL21 transcripts levels in duodenal biopsies of 10 controls (blue), 8 Potential (orange) and 21 Active (red) celiac patients, as assessed by Taqman PCR. Two dotted lines indicate the cut-off used to define positive vs negative subjects. Number and percentages of patients in each quadrant are displayed in the table. IL15RA and IL21 correlation was assessed by Pearson’s test, p<0.0001, R2=0.5. (B) Alignment of the amino acid sequences of the D-helices of IL15 (NP_000576.1, 144–162) and IL21 (NP_068575.1, 133–153) and BNZ-2. Conserved positions are in green, IL15 specific in pink, IL21 specific in yellow, unique residues in white. (C) One representative blot displaying pSTAT1, pSTAT3 and pSTAT5, pAKT and pERK in human IE-CTL lines in response to IL15 (140pM) and IL21 (4 and 14pM) in absence (left) or presence (right) of BNZ-2 (3uM). (D-E) Quantification by densitometry of seven WB for pSTAT1 and pSTAT3 (D) upon stimulation with IL21 (14pM) alone or in combination with IL15 and pSTAT5, pAKT and pERK (E) upon stimulation with IL15 alone or in combination with IL21 (14pM). (F) Quantification of seven WB displaying levels of pSTAT1, pSTAT3, pSTAT5, pAKT, pERK in response to IL15 (140pM) + IL21 (14pM) in absence or presence of 3uM BNZ-2. (D-F) Phospho-protein levels are normalized to averaged ERK and actin total protein levels for each condition. Paired one-way ANOVA was performed, *p<0.05.

