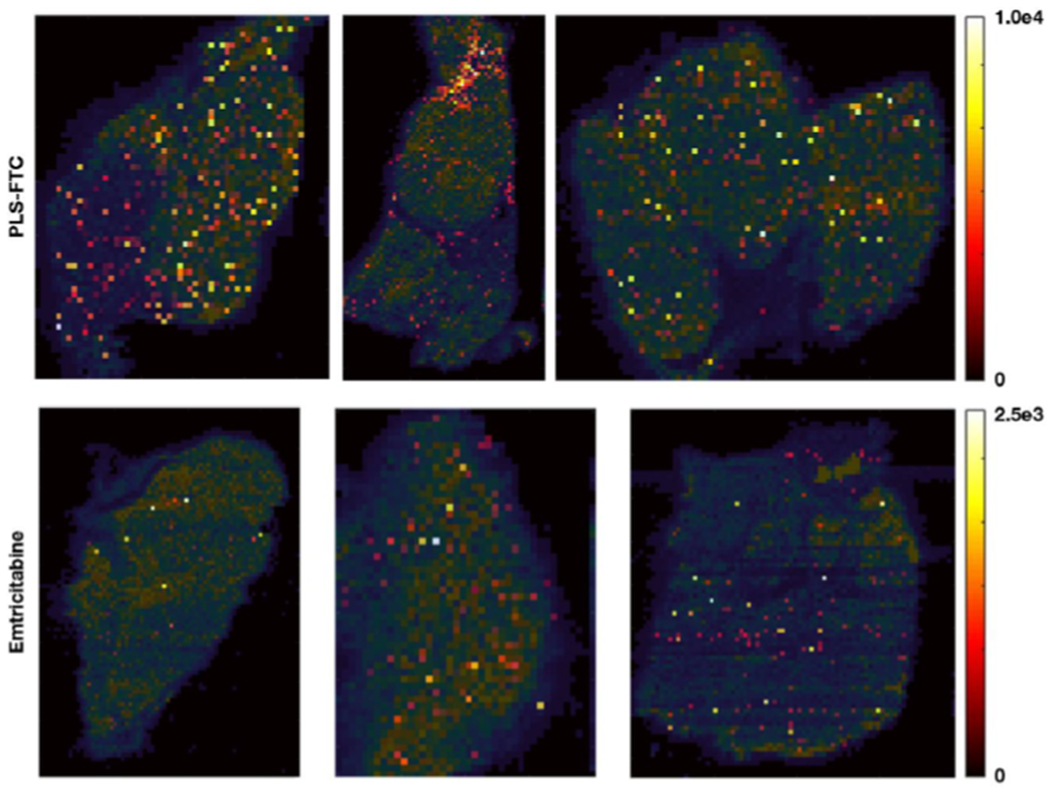
Figure 13.

Spatial distribution of FTC in axillary lymph nodes 4 h post dose measured by IR-MALDESI MSI. FTC signal abundance, shown using a color map ranging from dark/red for areas of low concentration to yellow for areas of high concentration, is overlaid on the ion map for cholesterol (shown in blue-green color map) to indicate section shape and extent.
