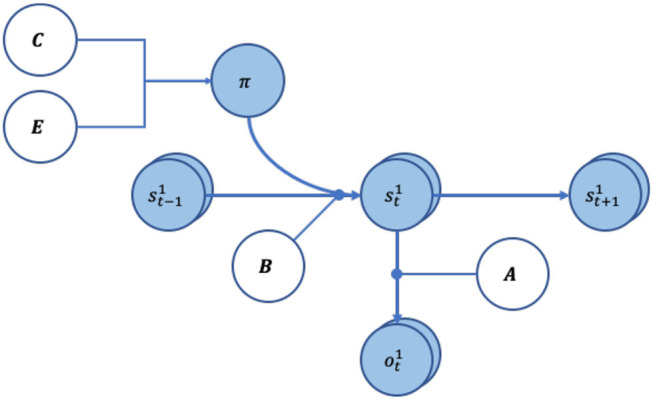
Figure 1.

Graphical representation of the generative model. The arrows indicate conditional dependencies, with the endpoint being dependant on where the arrow originated form. The variables in white circles show priors, whereas variables in light blue circles are random variables. The A and B matrices have round arrowhead to show they encode the transition probabilities between the variables.
