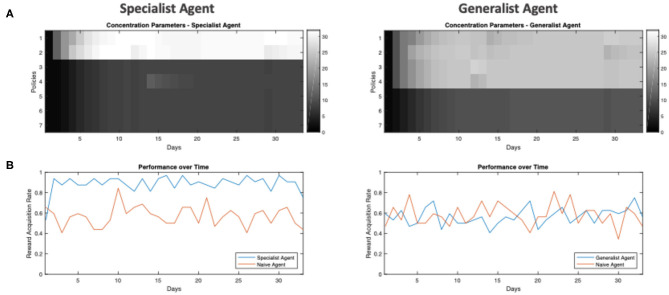
Figure 5.
Example performance of in-training agents over days. (A) Heat-map of e concentration parameters for each policy (separated by rows) over all 32 days of training (separated by columns). (B) The frequency at which the agent is able to get to the reward location when tested under ambiguity. This simulated testing is done after each day of training, where each agent is tested under ambiguity (the agent is 65% sure it sees the correct cue) for 32 trials, where the reward location / frequency in the testing environment is identical to the environment in which the agent is trained (i.e., a specialist agent is tested in an environment with low volatility and the reward always being on the left of the initial location). The frequency is computed from how many out of the 32 trials the agent is able to get to the true reward location.

