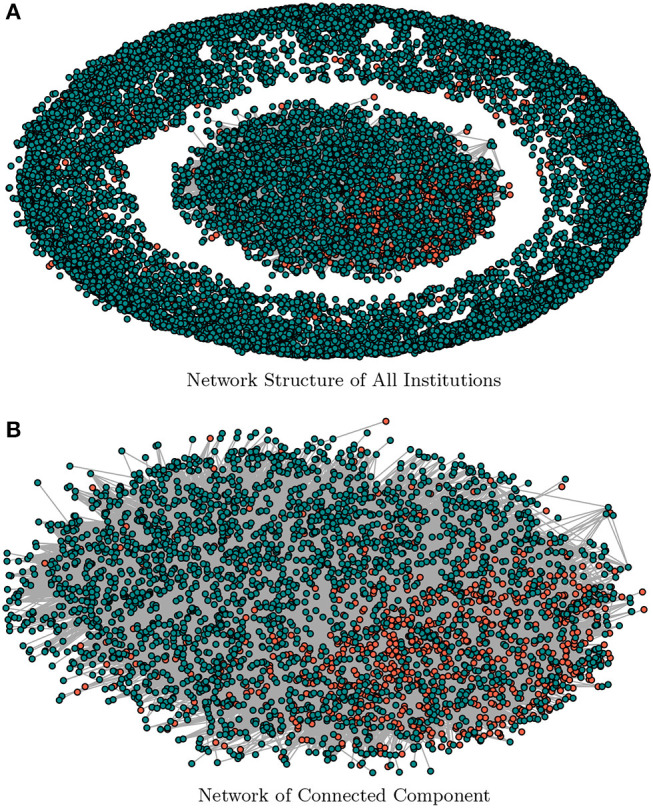
Figure 1.

A graphical representation of the estimated factor network. (A) shows the structural representation of the factor network for threshold γ = 0.05, and (B) depicts the connected sub-population only. The nodes in red-color are defaulted class of companies and green-color coded nodes are non-defaulted class of companies. (A) Network Structure of All Institutions. (B) Network of Connected Component.
