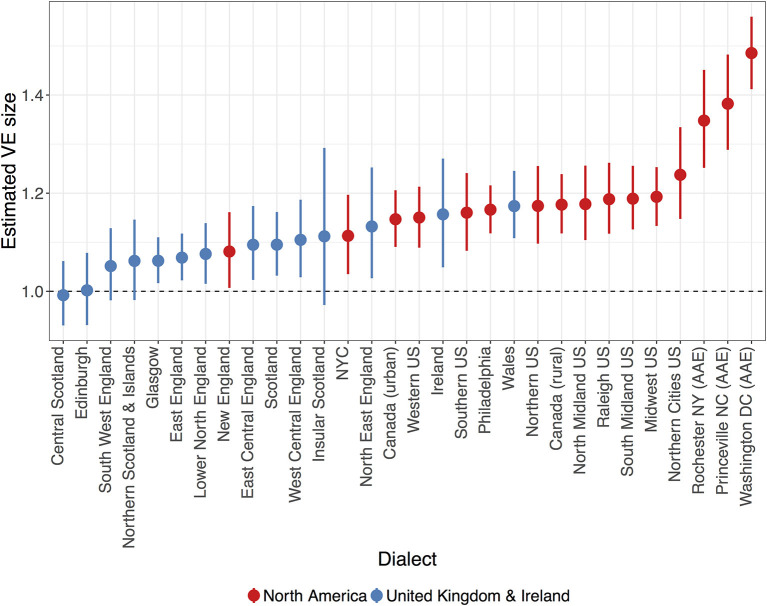
Figure 2.
Estimated VE size for each dialect analyzed in this study (red = North American, blue = United Kingdom and Ireland). Points and errorbars indicate the posterior mean value with 95% credible intervals, whilst holding all other predictors at their average values. Dashed line indicates no difference between vowels preceding voiced or voiceless consonants.

