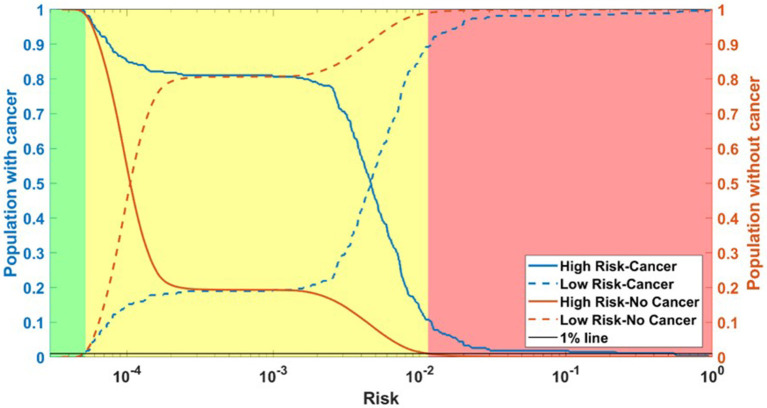
Figure 5.
Population with Cancer (blue) and without cancer (orange) as functions of high-risk (solid) and low-risk (dashed). Assuming a 1% miss classification rate in the low- and high-risk categories (black line), individuals can be divided into 3 categories according to their cancer risk: high (red), medium (yellow), and low (green) for DS3.

