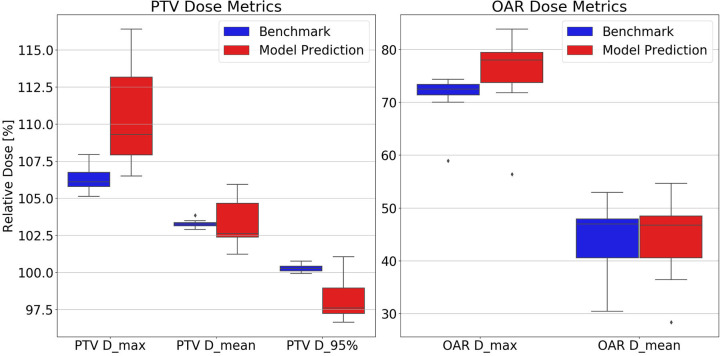
Figure 6.
Test set distributions of PTV (Left) and OAR (Right) dose metrics comparing benchmark and model-predicted plans. Model-predicted plans have higher PTV and OAR maximum dose and lower D95% than the other plan groups. Dose values are reported as percentage of the prescription dose. Dmax, maximum dose; Dmean, mean dose; D95%, minimum dose received by 95% of the volume.

