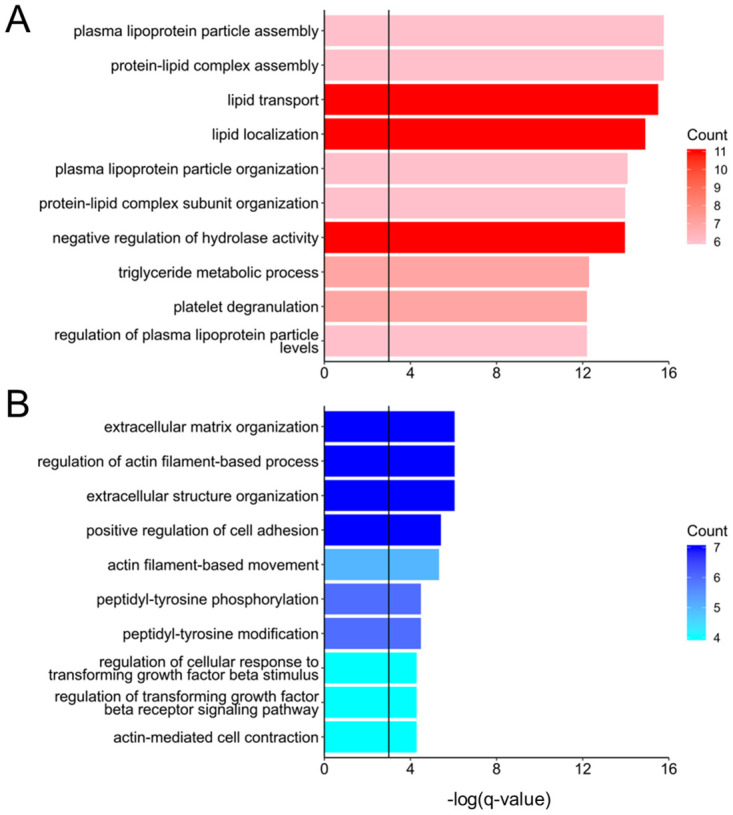
Fig 3. Gene Ontology (GO) analysis of A and B genes using DAVID.

The enriched terms in (A) the A genes are indicated by a reddish column, and those in (B) the B genes are indicated by a bluish column. The color depth corresponds to the number of counts. Black vertical lines show the -log(0.05) results for (A) A genes and (B) B genes.
