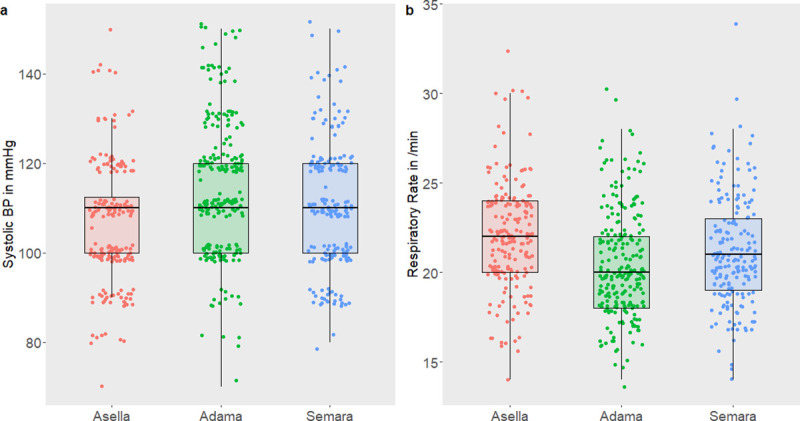
Fig 3.

Scatter plots of the vital parameters systolic blood pressure in mmHg (a) and respiratory rate in breaths/min (b) according to areas of residency. Individual measurements of participants are represented by colored dots, and medians as horizontal lines of box plots.
