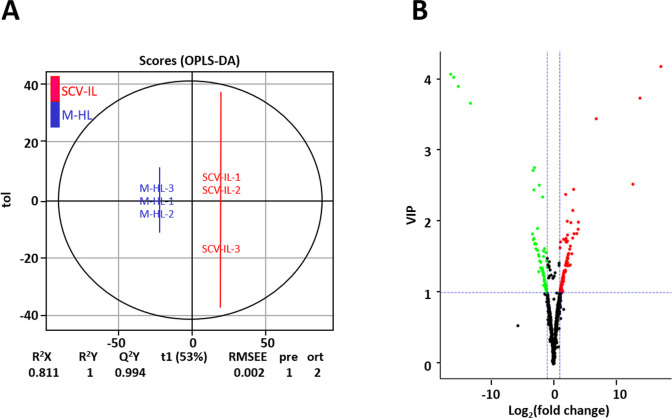
Fig 2.
OPLS-DA score plots (panel A) and the corresponding volcano plots (panel B) derived from differential metabolites of mock healthy leaf (M-HL) and SCV phytoplasma-infected leaf (SCV-IL) samples of sweet cherry trees. In panel B, red, green and black dots respectively represent up-regulated, down-regulated and unchanged metabolites between M-HL and SCV-IL samples.

