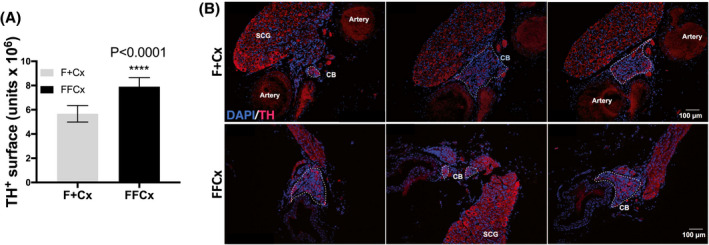
FIGURE 1.

Quantitative assessment of TH expression in the CB of mice at 72 weeks. A, TH+ area (arbitrary units) in carotid bifurcations based on analysis of nine TH‐Cre experimental (FFCx) and nine control (F + Cx) mice. Statistical analysis used a Student's t test where significance is reported for P‐values below .05. Bars represent mean ± SEM. B, Example immunofluorescent staining shows TH (red) and DAPI (blue) where the discontinuous white line outlines the CB regions in each section
