FIGURE 3.

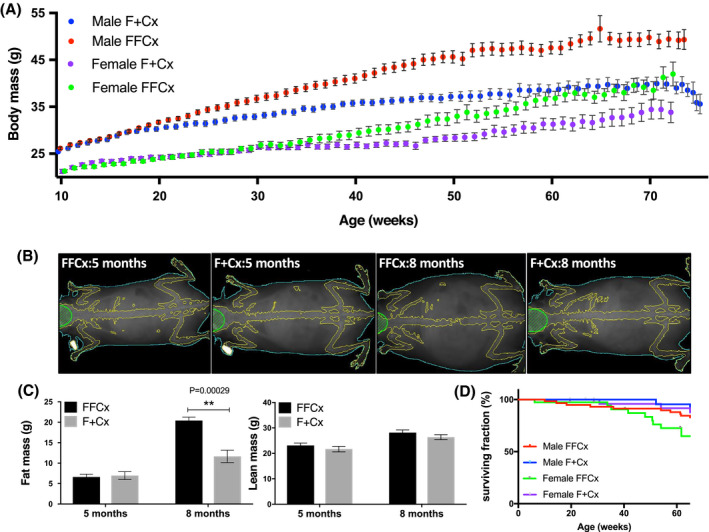
Obesity in experimental mice upon SDHC loss in TH+ cells. A, Body weight over 78 weeks. Numbers of mice for each genotype were: 36 FFCx and 30 F + Cx males; 28 FFCx and 30 F + Cx females. B, X‐ray imaging of representative mice at 20 (preobese) and 32 (obese) wk using densitometry with dual energy X‐ray absorptiometry (DEXA) in a Lunar PIXImus scanner. C, Fat and lean mass for seven experimental and seven control mice at 20 and 32 weeks. D, Survival of mice represented in panel A. Statistical analyses were performed using Prism 8 with bars indicating mean ± SD. Fat and lean mass data were analyzed by two‐way ANOVA with Tukey's correction test over genotype and time
