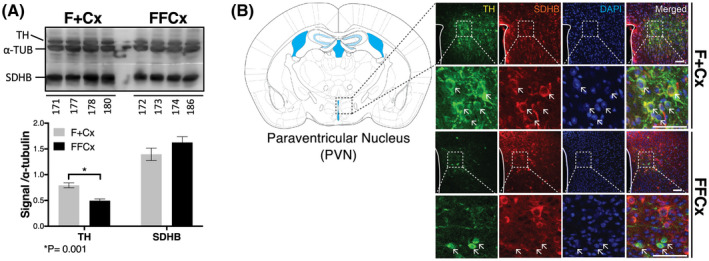
FIGURE 6.

Changes in TH+ cells in key regions of the hypothalamus important for feeding behavior. A, Western blot analysis of TH and SDH (represented by SDHB) in hypothalamic preoptic tissue for the indicated four representative animals. Western blot signal quantitation statistics were analyzed using a Student's t test with bars indicating mean ± SD. B, Fluorescent immunohistochemical staining analysis of the PVN monitoring TH (green), SDHB (red), and DAPI (blue) Arrows indicate example cells showing contrasting features. Scale bar: 50 µm
