
Fig 1. Principal coordinate analysis plot of Bray-Curtis distance matrices between each eye of 12 horses.
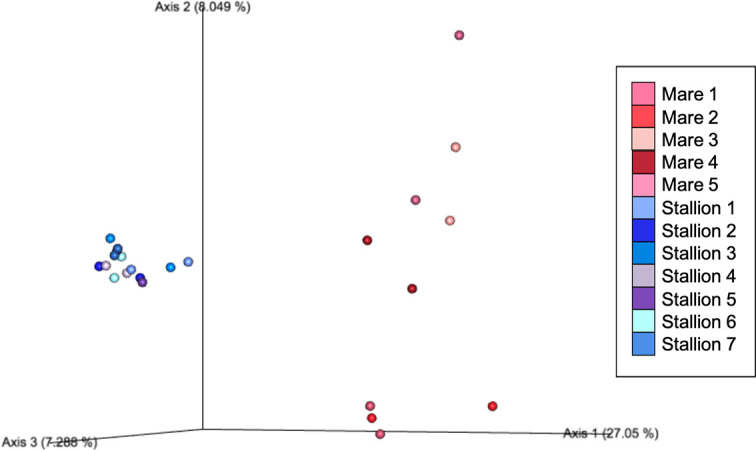
Each dot represents the microbial composition of one eye. The dots which are shades of blue representing stabled stallions are clustered, indicating a similar community structure within that housing environment. The dots which are shades of red representing pastured mares are more dispersed, indicating that their individual mycobiome structures are more diverse, and distinct from stabled stallions.