Fig. 2.
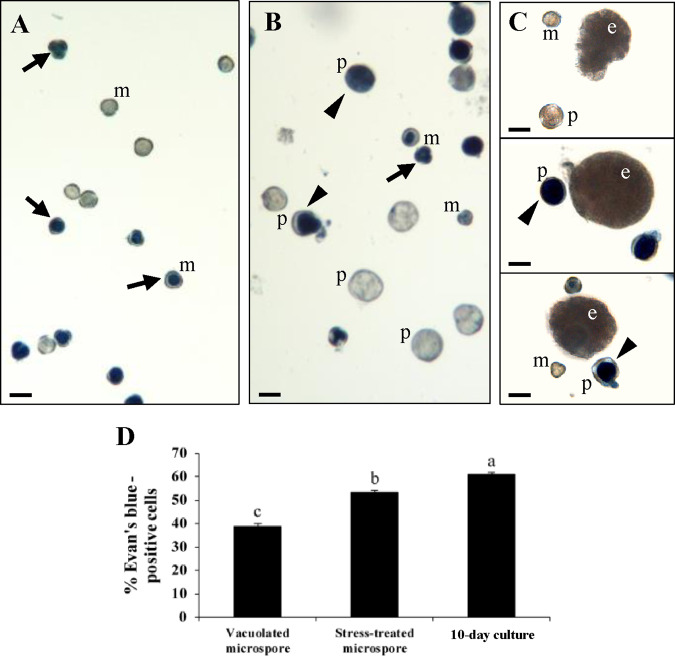
Cell death in stress-induced microspore embryogenesis. Representative micrographs of Evan’s blue staining showing cell death in: (A) microspores (m) before stress; (B) stress-treated microspore culture, containing microspores (m) and proembryos (p); (C) 10-day culture composed by globular embryos (e), as well as microspores (m) and proembryos (p). Arrows: dead microspores; arrowheads: dead proembryos; Scale bars: 10 �m. (D) Quantification of cell death. The data represent mean � SEM. Different letters indicate significant differences (chi-square test at P < 0.05).

