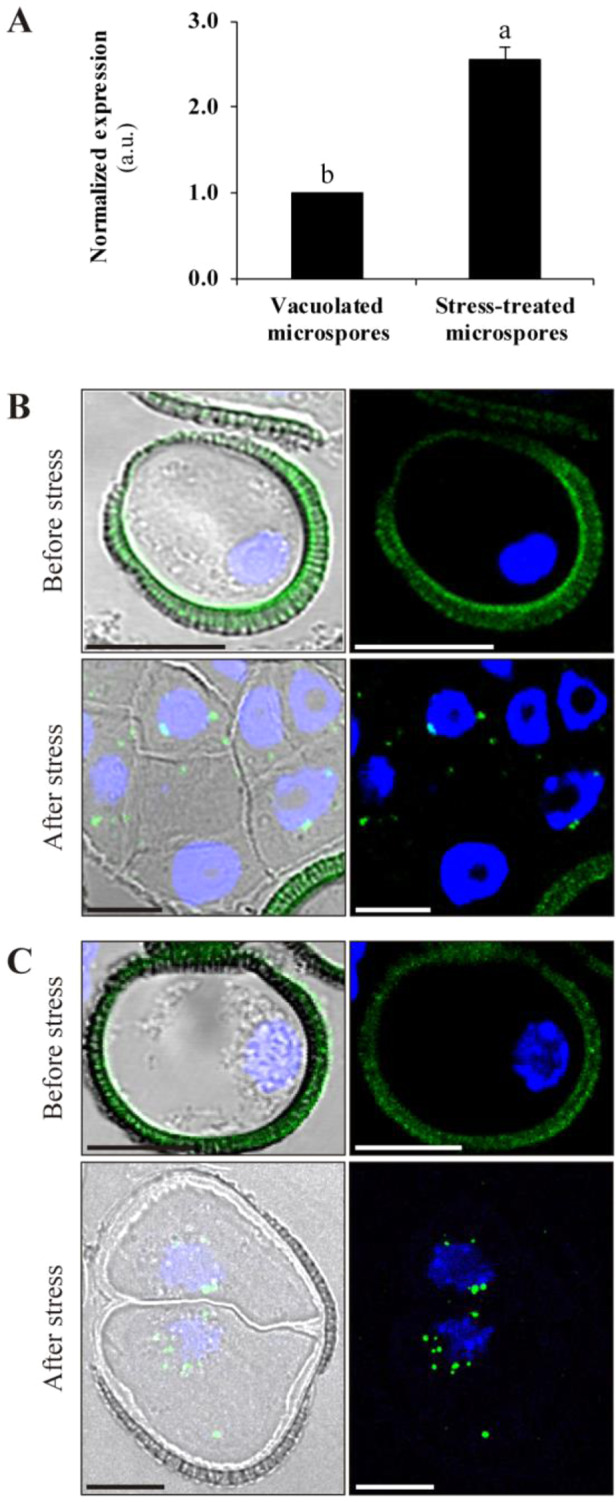
Fig. 5.

Expression and localization of autophagy-related proteins in microspore embryogenesis. (A) BnATG5 mRNA levels in stress-treated microspores compared to vacuolated microspores before stress, as determined by RT-qPCR. The data represent mean � SEM. Expression levels were normalized to vacuolated microspores. Different letters indicate significant differences (Student’s t-test at P < 0.05). Immunofluorescence and confocal microscopy analysis of ATG5 (B) and ATG8 (C) in vacuolated microspores (before stress) and stress-treated microspores (after stress). Left panels are merged images of Normarsky’s differential interference contrast, ATG5 or ATG8 immunofluorescence signal (green) and DAPI staining of nuclei (blue). Right panels are merged images of ATG5 or ATG8 immunofluorescence signal (green) and DAPI staining of nuclei (blue). Scale bars: 10 �m.
