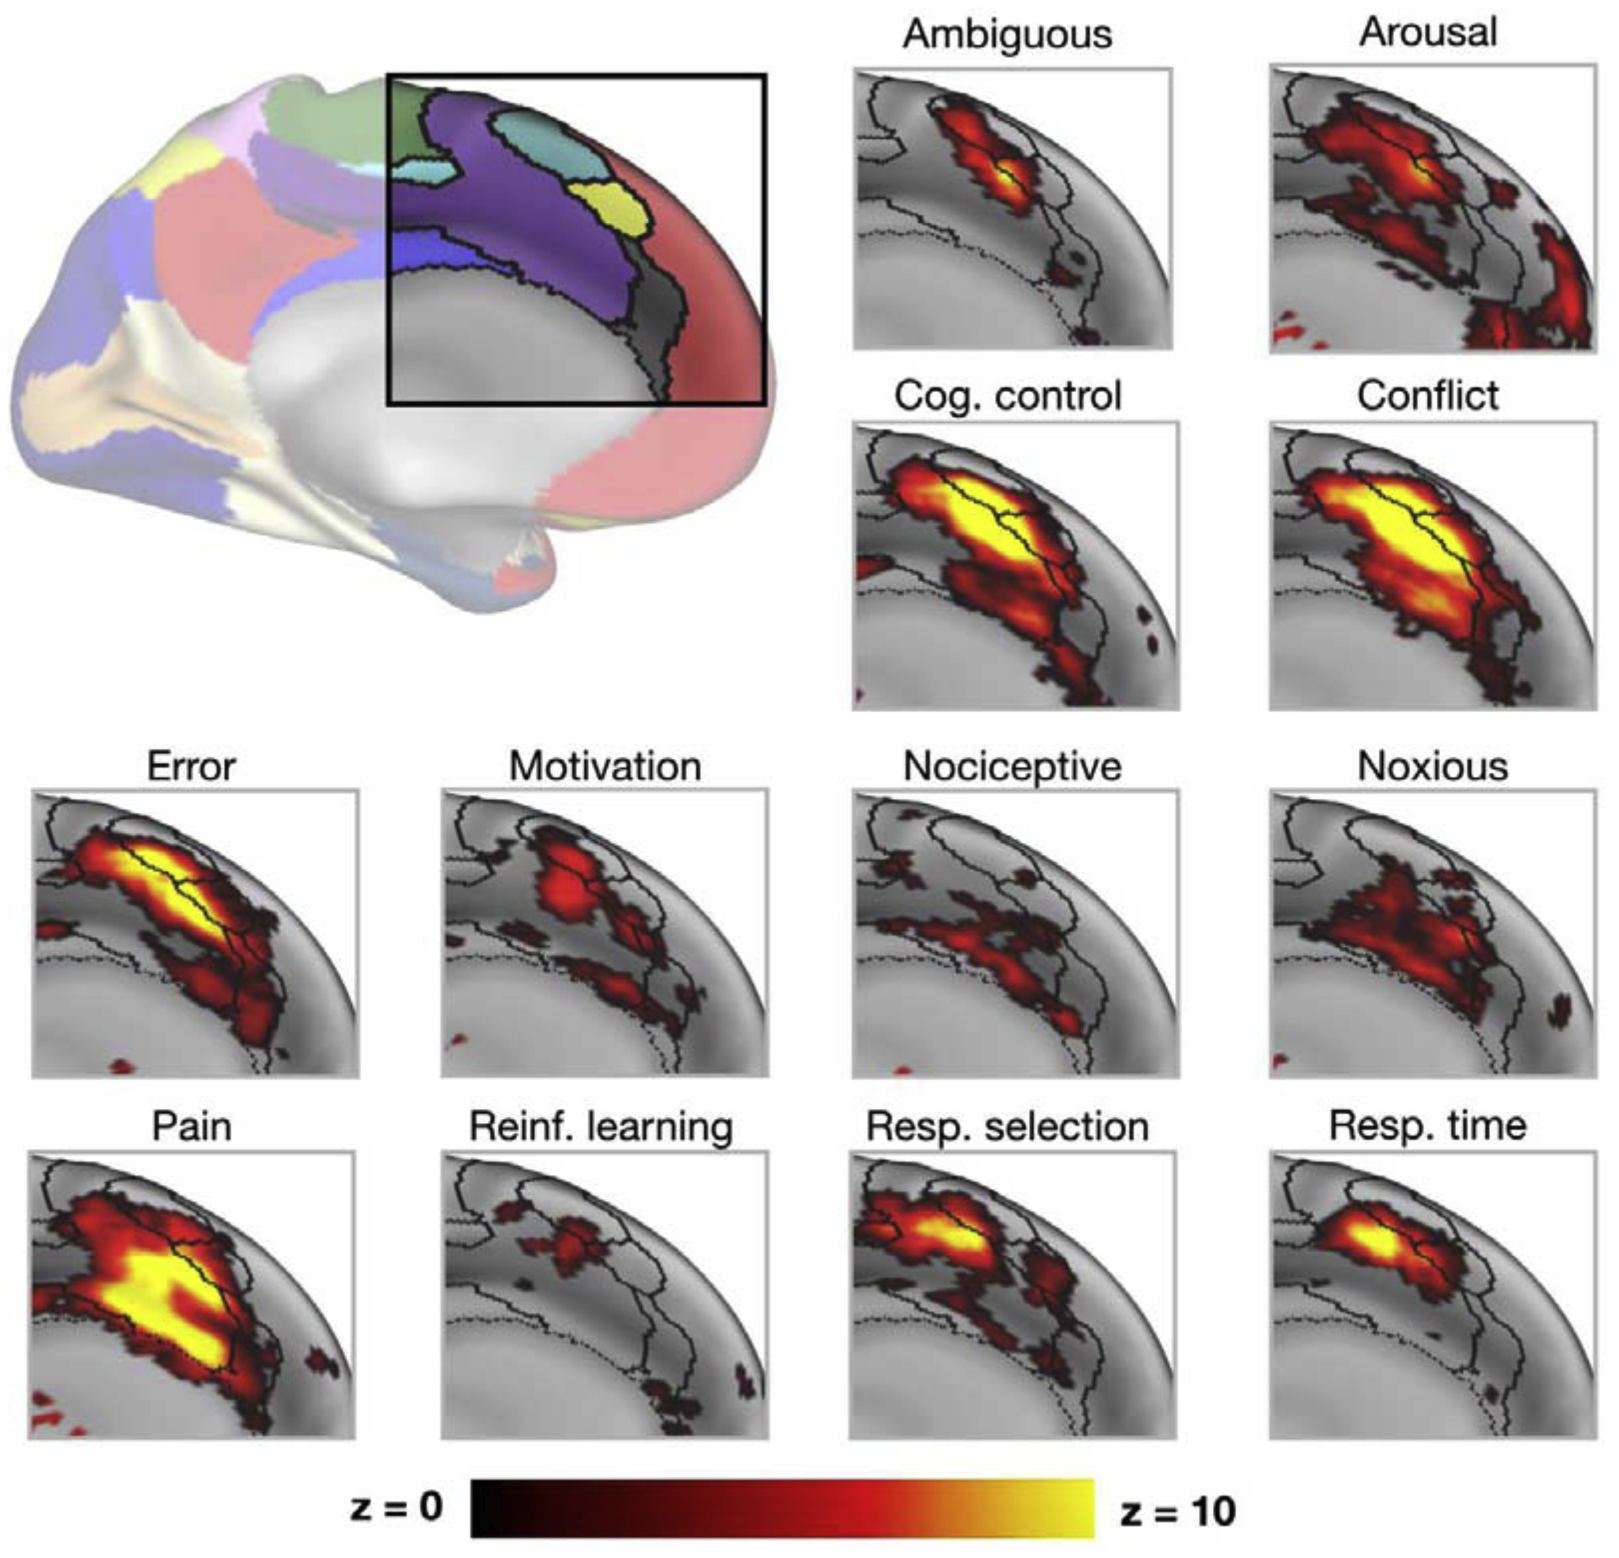
Figure 2: Diversity of functional activations in the dACC/mFC.

The top left inset shows the functional networks typically identified in the dACC/mFC based on group-average data. Other subplots show Neurosynth [31] uniformity images, focused on terms that have been associated with dACC/mFC functions in past literature (black lines = borders of functional networks from inset as identified by Gordon and colleagues [13]). Note that many activations overlap with multiple networks and cross network boundaries. Moreover, note also that these group-average networks show substantial variability across individual subjects in Figure 3.
