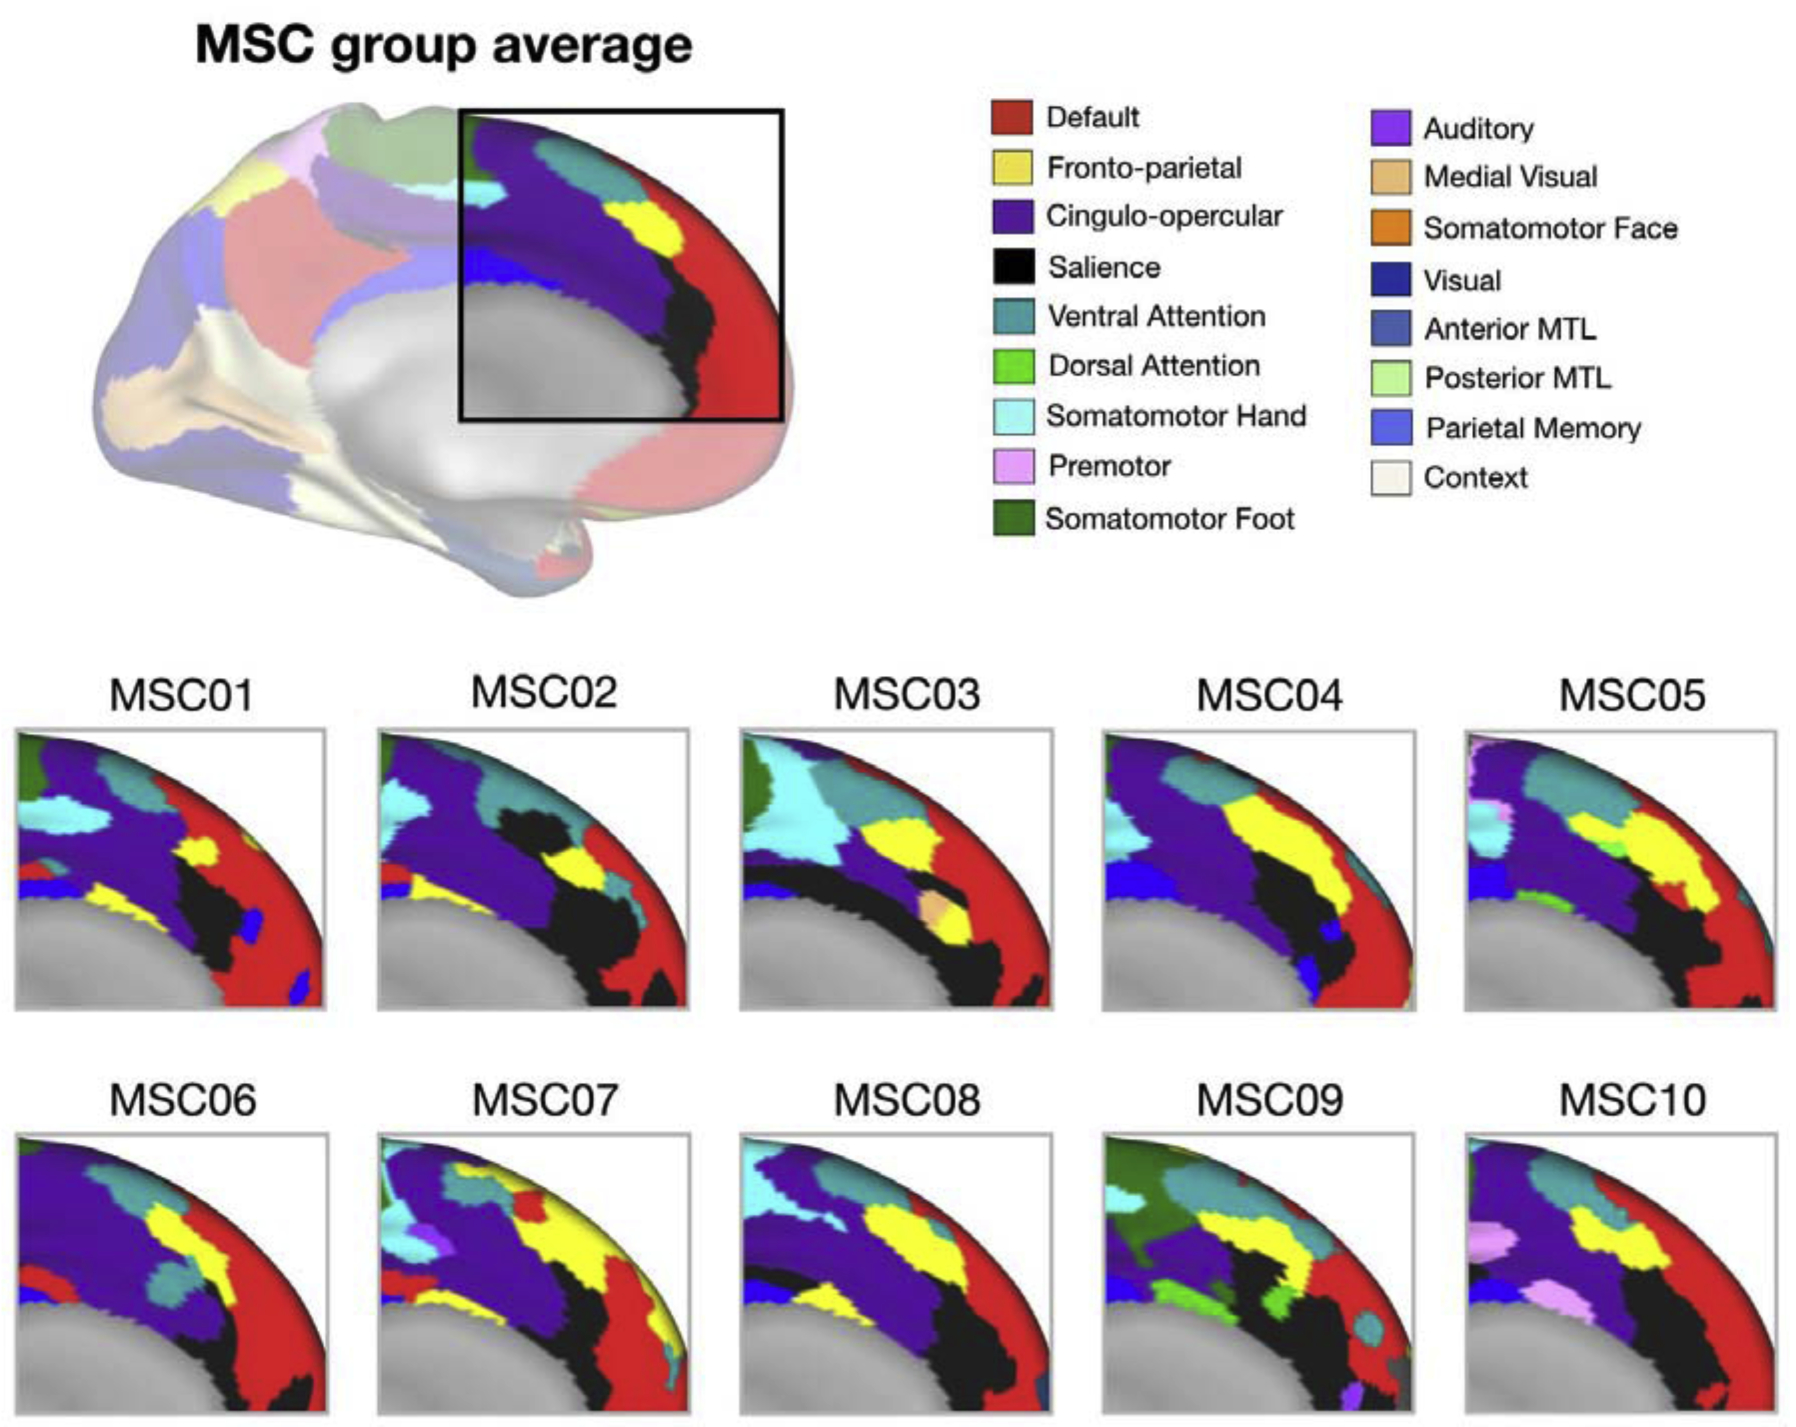
Figure 3:

Inter-individual variability in dACC/mFC networks. Functional networks (different colors) in the dACC/mFC on average across a group of individuals in the Midnight Scan Club (top, MSC) or for each individual separately (bottom), derived from resting-state fMRI data [13]. Note the heterogeneity in network assignments across subjects, such that a given position in the group average can be associated with alternate networks in particular subjects.
