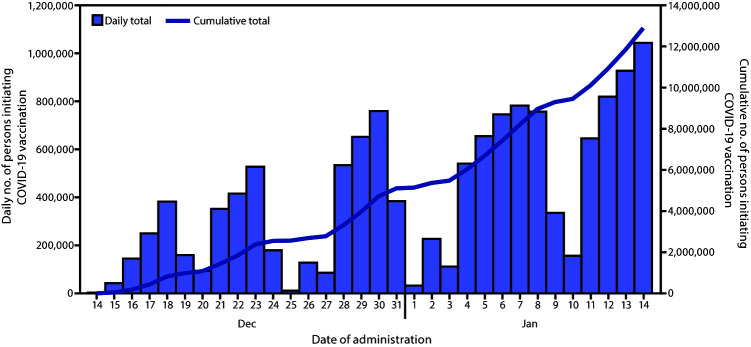
FIGURE.
Number of persons initiating COVID-19 vaccination, by date of vaccine administration (N = 12,928,749) — United States, December 14, 2020–January 14, 2021*
Abbreviation: COVID-19 = coronavirus disease 2019.
* Vaccines administered December 14, 2020–January 14, 2021, and reported to CDC by January 26, 2021.

