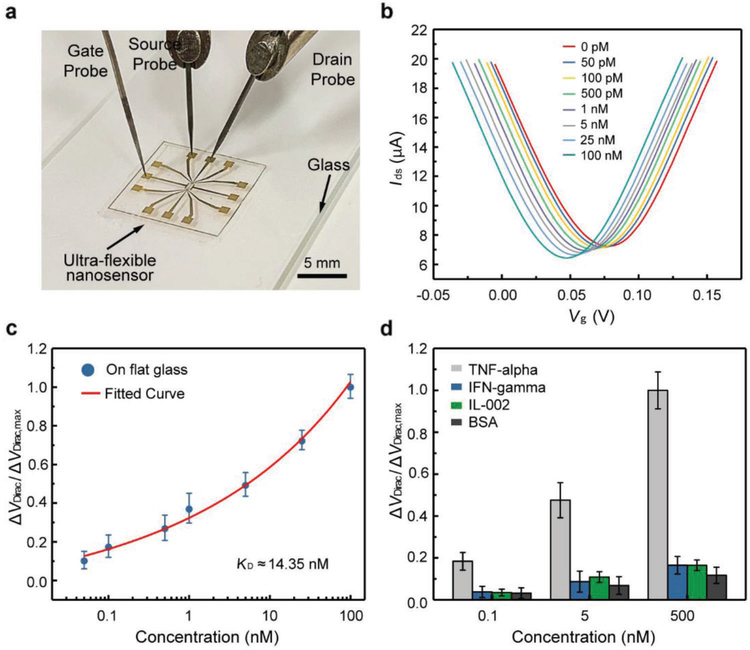
Figure 3.
Biomarker detection using the GFET nanosensor. a) Photograph of the nanosensor placed on a glass slide for biomarker detection. b) Transfer characteristic curves measured when the nanosensor was exposed to TNF-α solution with different concentrations. c) Voltage shift as a function of the TNF-α concentration. The fitted curve is a least-squares fit to the Hill-Langmuir binding model. d) The normalized Dirac point shift showing the response of then a nosensor to different concentrations(0.1,5, and 500×10−9M) of TNF-α and the control proteins (IFN-γ, IL-002, and BSA).

