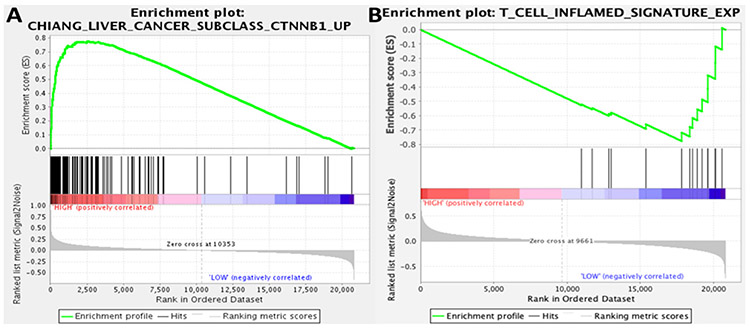
Figure 3.
Gene set enrichment analysis associates tumor FCH uptake with immunotherapy-relevant expression profiles. Gene set enrichment plots are based on 41 tumor samples (31 FCH-avid, 10 FCH non-avid): (A) tumors showing high FCH metabolism were significantly enriched for genes from a CTNNB1 activation signature (FDR 0.062); and (B) a signature of T-cell inflammation that can predict immunotherapy response in several different tumor types was enriched by tumors that showed low FCH metabolism (FDR 0.116)

