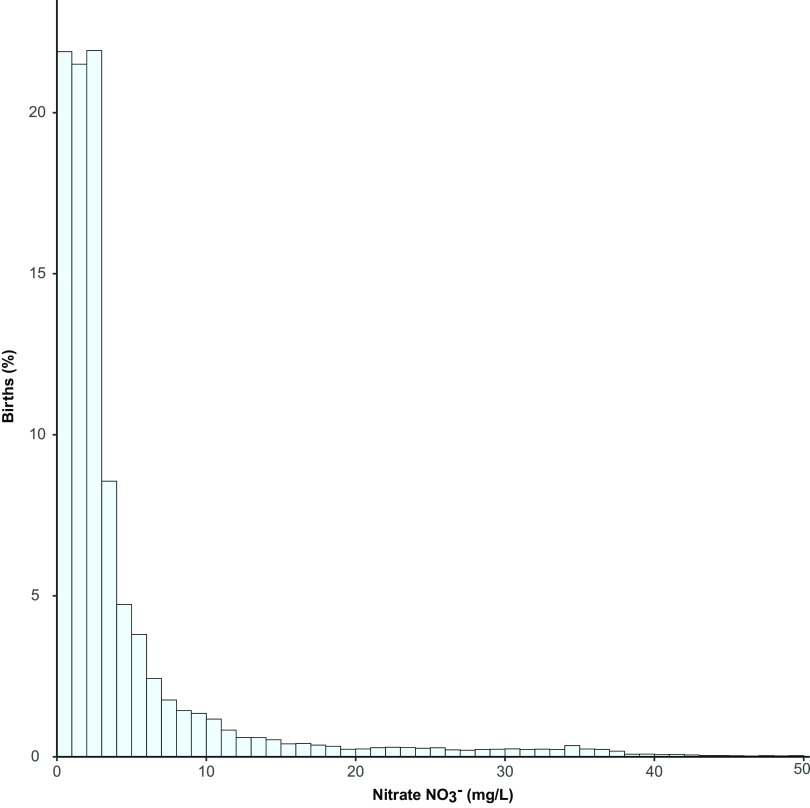
Figure 2.
The distribution of the pregnancy average nitrate exposure in the birth weight study population, truncated to those with average nitrate exposure (). Note: 10th percentile: ; 90th percentile: . Main birth weight model covariates included: maternal age, calendar year, sex, gravidity, maternal smoking, maternal education, maternal income, maternal employment status, region, and urbanicity.

