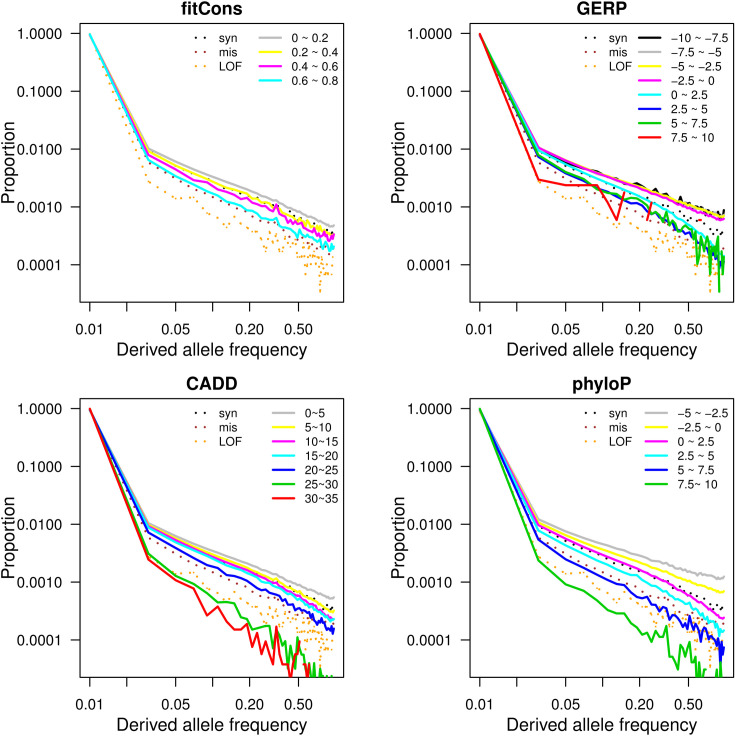
Fig 1. Derived allele frequency spectra of different score categories for each deleteriousness prediction scoring method.
For each scoring method, polymorphic sites are grouped into score intervals by the value of the score annotated at the sites. Each solid line represents derived allele frequency spectrum of polymorphic sites belonging to one score interval and three dashed lines represent derived allele frequency spectra of three control categories: synonymous (syn), missense (mis), and loss of function (LOF) variants.

