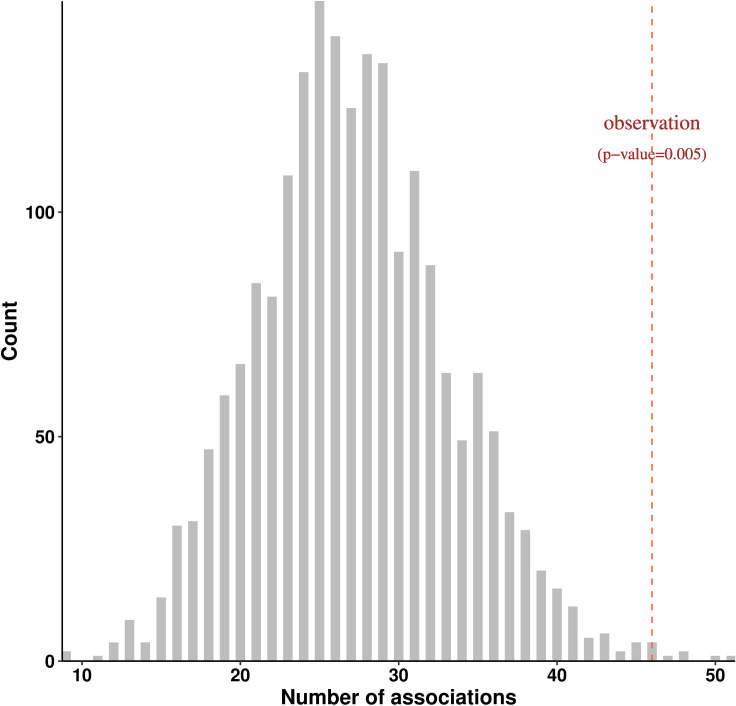
Fig 3. Enrichment of clinical phenotypes nominally associated with coding load score.
Null distribution of the number of clinical phenotypes weakly associated with coding load score was obtained from 2,000 permutations in total. For each permutation, coding load score was shuffled randomly among 335,161 samples and the number of association was the count of phenotypes which yielded a p-value < 0.05 in the association tests between permuted load score and 539 phecodes. Red dashed line indicates the observed number of clinical phenotypes nominally associated with coding load score (n = 46).

