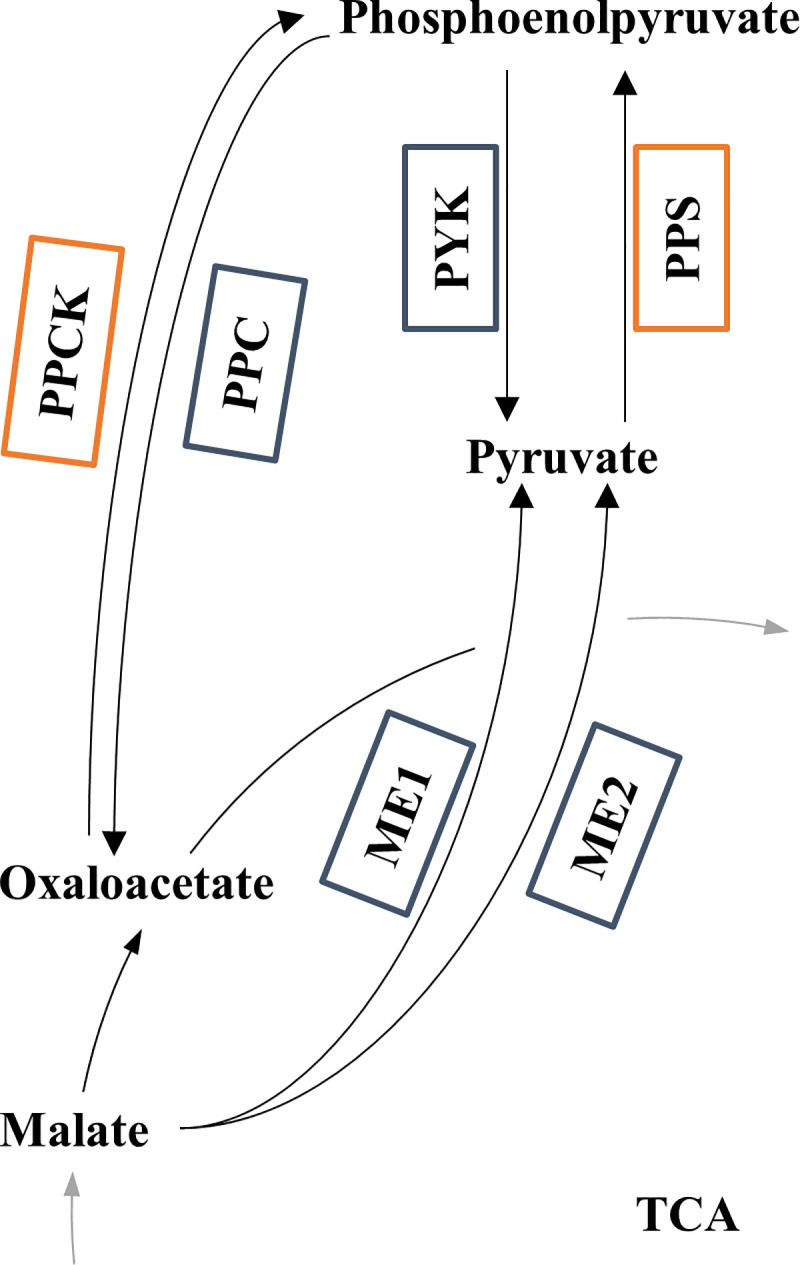
Fig 2. Anaplerotic node for E. coli.

Set of carboxylation/decarboxylation reactions including phosphoenolpyruvate, pyruvate, oxaloacetate, and malate. Arrows indicate the expected direction of carbon fluxes. Boxes refer to reactions: blue when they are defined in both the GSM and the metabolic network used for 13C-MFA, and orange when they are exclusively considered in the GSM. In the latter case no mapping was possible (S1 Table).
