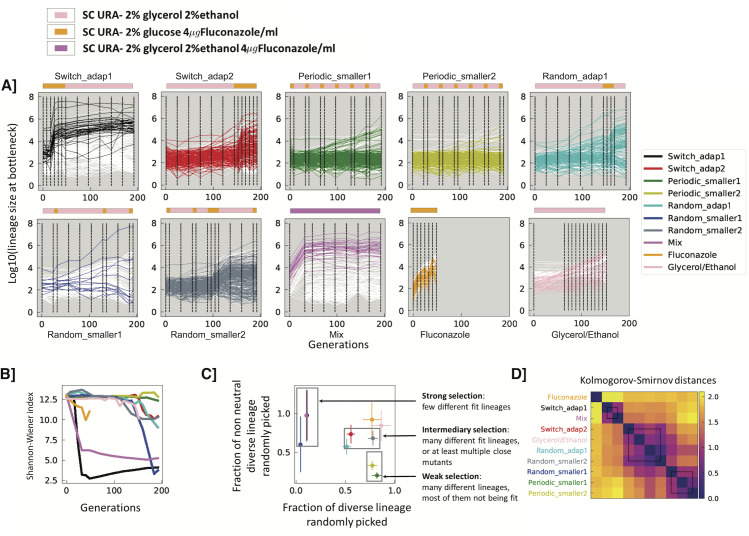
Fig 2.
A] Lineage tracking data for a subsample of 300 lineages for each experiment over the course of 192 generations. Colored lines correspond to lineages for which single colonies were later isolated; white lines correspond to a randomly selected set lineages which were not sampled for fitness remeasurement. Dashed lines represent sampled time points. Environments are indicated by the color strips above each graph, with colors as in Fig 1. B] Shannon-Wiener index, calculated using frequencies for all lineages in each experiment. C] Strength of selection. 336 lineages were randomly picked from each experiment at generation 192, and we determined the fraction that were non-neutral (y-axis) and how many unique barcodes there were, out of 336 (x-axis). Error bars indicate error based on counting statistics. D] Similarity of experimental conditions. Kolmogorov Smirnov distances were calculated between all the experimental conditions based on the fitness remeasurement data (see Methods for details). The distance matrix was hierarchically clustered.

