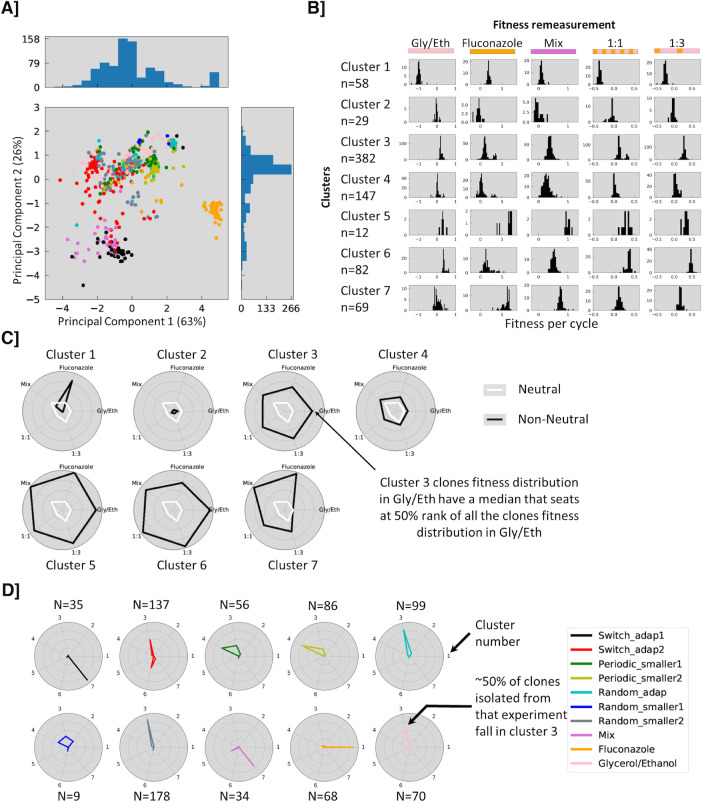
Fig 5. Fitness clusters.
A] PCA analysis of combined fitness data. Each clone is represented by a five-dimensional vector of fitness values, which is projected onto a 2D space using PCA. Clones with similar fitness vectors are close together and clones from the same experiment are frequently close to one another (switch_adap2, random_smaller2, random_adap1 or fluconazole). B] Distribution of fitness effects in the different remeasurement experiments for each cluster (see S8C Fig for cluster membership). C] Spider plot of cluster characteristics in the different remeasurement experiments, indicating (in black) the percentile rank of the median fitness for each cluster in a given remeasurement environment. For example, cluster 1 is highly specialized in Fluconazole whereas cluster 5 is describing generalist behavior type. White lines indicate neutral fitness in each environment. D] Spider plot indicating the fraction of isolated clones in each cluster from each evolution environment.

