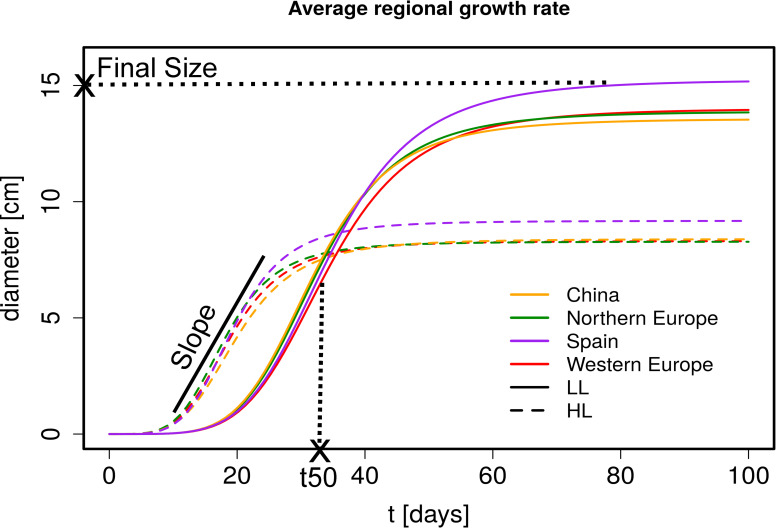
Fig 1. Regional growth rate estimates in HL and LL.
Predicted growth curves averaged over region (from drm function). The growth curves were estimated from diameter measurements at different time points. Diameter measurements for HL are from day 11 to 46 and for LL from day 24 to 89. An illustration of the parameters that are estimated from these growth curves are included in the plot (Final Size is a diameter, t50 a time point and Slope the fold increase in the linear phase). HL (dashed line), LL (solid line), China (orange), Northern Europe (green), Spain (purple) and Western Europe (red).

