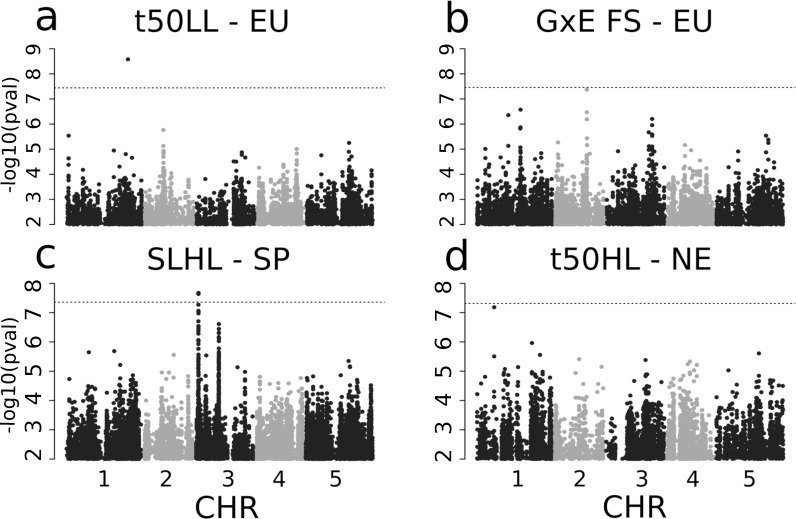
Fig 3. GWAS-results for 4 phenotypes.
Manhattan plots of GWAS of t50 in LL with all European genotypes (a), with a peak on Chromosome 1, GxE of Final Size with all European genotypes (b) with a peak on Chromosome 2, Slope in HL within Spain (c) with a peak on Chromsome 3 and t50 in HL in Northern Europe (d) with a peak on Chromosome 1. The dotted line shows the corresponding Bonferroni threshold adjusted for a p-value of 0.05.

