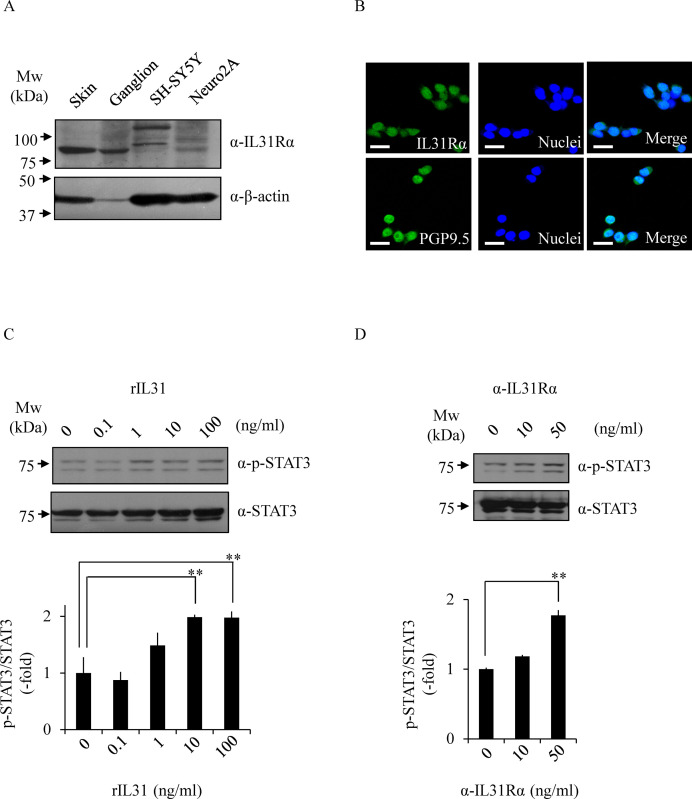
Fig 3. Functional expression of IL-31R in Neuro2A cells.
The expression of IL-31Rα was determined by immunoblotting with anti-IL-31Rα antibody and anti-β-actin antibody (loading control) (A). The expression of IL-31Rα was analyzed by immunocytochemistry with anti-IL-31Rα antibody (green) or anti-PGP9.5 antibody (green) and Hoechst33342 (blue; Nuclei) (B). The representative micrographs are shown. Scale bar, 100 μm. Phosphorylated STAT3 at Tyr705 was analyzed by immunoblotting. The cells were treated with rIL-31 (C) or anti-IL-31Rα antibody (D) at indicated concentrations, and the cell lysates were examined by immunoblotting with indicated antibodies. The representative images are shown (upper) and the quantitative data of the ratios of phosphorylated STAT3 versus STAT3 are shown (lower). Data are pooled from three independent experiments and shown as mean and SD. **p < 0.01, as compared with control (one-way ANOVA/Tukey-Kramer post-hoc comparisons).

