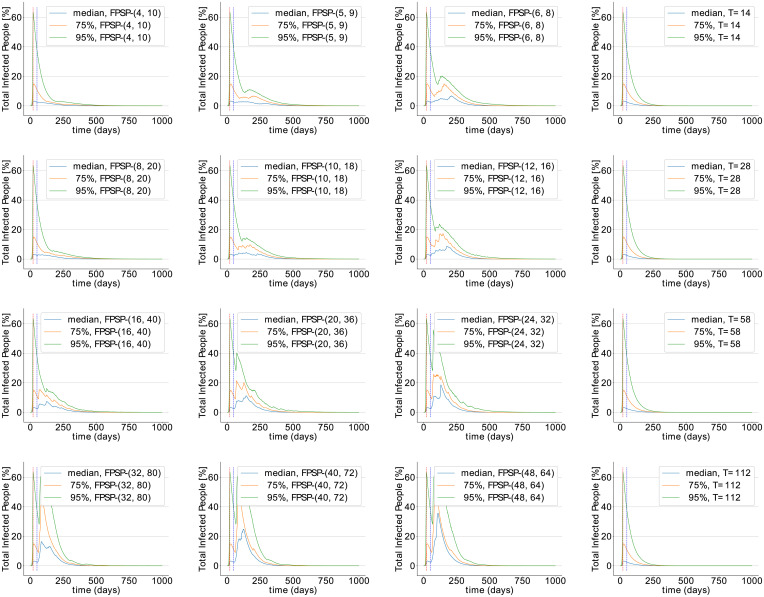
Fig 11. Sensitivity analysis of the quantity I + D + A + R + T in the SIDARTHE model on uncertainty in epidemiological model parameters.
The y-axis has a linear scale for better visibility of differences across plots. Simulations in each row have fixed period length. Simulations in each column have fixed duty-cycle apart from the right-most column, which shows the effect of the outer loop. Parameters were sampled from zero-truncated Normal distributions with means σ1, …, σ16 and 10% standard deviation. β was estimated from samples of the basic reproduction number representing the consensus distribution in [39].

