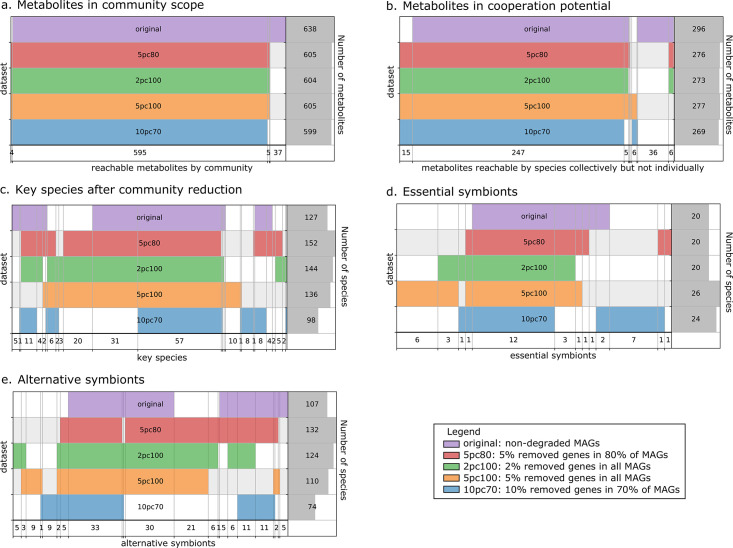
Figure 3. Robustness analysis of Metage2Metabo (M2M) results on datasets of altered metagenome-assembled genomes (MAGs).
A proportion of genes were randomly removed from all or a random subset of the 913 rumen MAGs: 2% from all genomes (2pc100), 5% from 80% of the genomes (5pc80), 5% from all genomes (5pc100) and 10% from 70% of the genomes (10pc70). M2M pipeline was ran on these four datasets and comparison was made with respect to the initial non-altered dataset of MAGs (original). Subfigures a to e each represent one piece of information computed by M2M and compared between the five experiments. (a) Set of producible compounds by all metabolic networks in a cooperative system (community scope); supervenn representation. Each dataset of metabolic networks obtained from the original or degraded genomes is represented horizontally, with a unique colour. The right panel of the supervenn diagram indicates the number of metabolites in the community scope of the corresponding dataset. Vertical overlaps between sets represent intersections (e.g groups of metabolites retrieved in several datasets) whose size is indicated on the X axis. For example, there is a set of 37 metabolites that are producible in the original dataset only, and a set of 5 metabolites predicted as producible in all datasets but the one where 70% of genomes were 10%-degraded. A full superimposition of all the coloured bars would indicate a complete stability of the community scope between datasets. (b) Comparison of the cooperation potential between the five experiments. (c) Comparison of key species that gather essential symbionts (d) and alternative symbionts (e).

