. 2021 Jan 19;10:e64509. doi: 10.7554/eLife.64509

Figure 7. Detection of positive selection is not biased by recombination.

OC43 lineage A sequences were simulated with varying levels of recombination and positive selection. The Bhatt method was used to calculate the rate of adaptive substitutions per codon per year for S1 (light orange), S2 (light gray), and RdRp (dark gray). The mean and 95% confidence interval of 10 independent simulations are plotted.

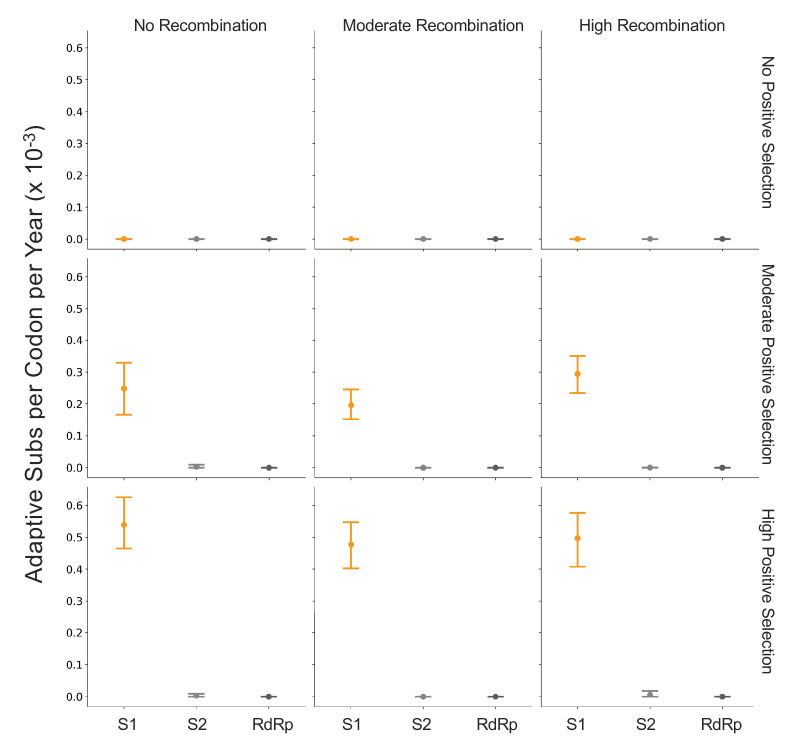
Figure 7.

Figure 7—figure supplement 1. Fewer years of longitudinally sampled isolates reduces ability to detect rate of adaptation.

Figure 7—figure supplement 1.

OC43 lineage A S1 sequences were simulated under conditions of no, moderate, and high rates of recombination in combination with no, moderate, or high strength of positive selection. The Bhatt method was used to calculate the ‘true’ rate of adaptive evolution under each of these scenarios using all available simulated sequence data (30 years), or the estimated rate if only the most recent 24, 14, 10, or 7 years of simulated sequences were used. The mean and 95% confidence intervals of 10 independent simulations are plotted.
Figure 7—figure supplement 2. Representative phylogenies of simulated spike data.

Figure 7—figure supplement 2.

OC43 lineage A spike sequence evolution was simulated under conditions of no, moderate, and high rates of recombination in combination with no, moderate, or high strength of positive selection. This figure shows time-resolved phylogenies built from 1 of the 10 independent simulations under each recombination/selection regime.