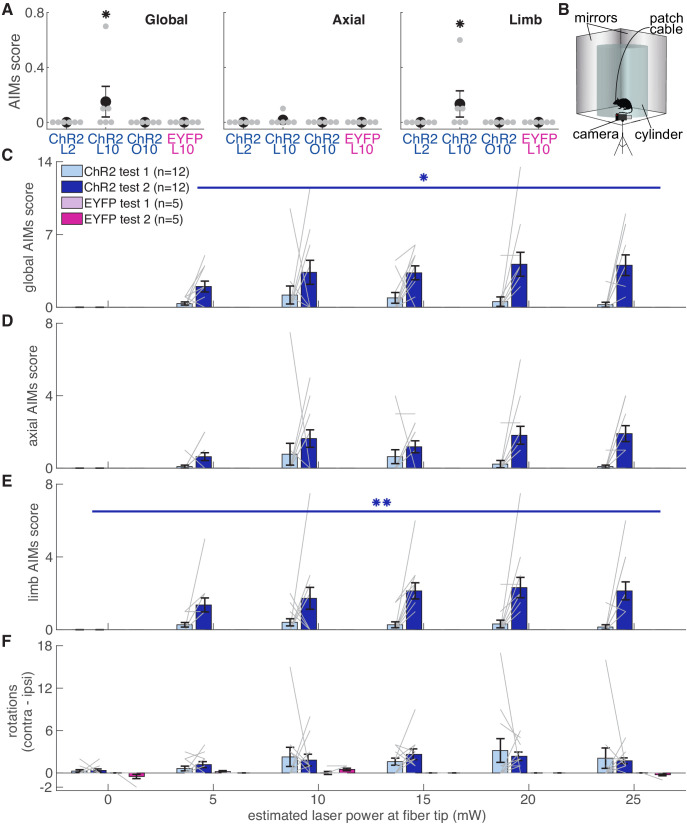
Figure 11. Dopamine neuron stimulation induces context- and history-dependent abnormal involuntary movements.
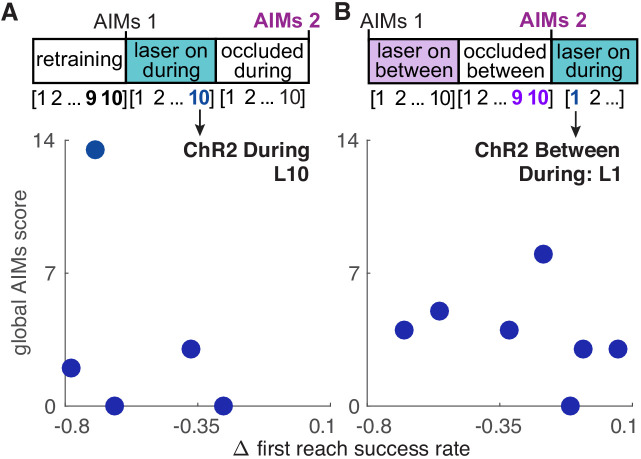
(A) Average AIMs scores during reaches for ‘ChR2 during’ rats on days 2 and 10 of ‘laser on’ sessions, and day 10 of ‘occlusion’ sessions. Also, AIMs scores during reaches for ‘EYFP’ rats on ‘laser on’ day 10. Global (Kruskal-Wallis: χ2(3)=9.31, p=2.54×10⁻²) and limb (χ2(3)=9.31, p=2.54×10⁻²) AIM scores were higher in ‘laser on’ session 10 for ChR2 rats. Axial AIM scores did not differ between groups (χ2(3)=2.83, p=0.42). * indicates p<0.05. (B) Experimental set-up for AIMs test. (C) Average global AIMs scores vs. estimated power at the fiber tip. Global AIMs increased with increasing laser power and from test day 1 to 2 in ChR2-injected rats (linear mixed model: interaction between test number and laser power: t(164) = 2.57, p=0.01). EYFP-injected rats did not display AIMs (linear mixed model: interaction between test number and laser power: t(164) = 0.00, p=1.00). ChR2-injected rats’ global AIMs scores did not differ significantly from EYFP-injected rats’ global AIMs scores on test day 1 (Contrast tests: 5 mW: t(164) = 1.57, p=0.12; 10 mW: t(164) = 1.71, p=0.09; 15 mW: t(164) = 1.45, p=0.15; 20 mW: t(164) = 1.17, p=0.24; 25 mW: t(164) = 0.98, p=0.33). Gray lines represent data from individual rats. Error bars represent s.e.m. across animals. (D) Average axial AIMs scores. ChR2: linear mixed model: interaction between test number and laser power: t(165) = 1.91, p=0.06. EYFP: t(165) = 0.00, p=1.00. ChR2-injected rats’ axial AIMs scores did not differ significantly from EYFP-injected rats’ axial AIMs scores on test day 1 (Contrast tests: 5 mW: t(165) = 1.36, p=0.18; 10 mW: t(165) = 1.46, p=0.15; 15 mW: t(165) = 1.22, p=0.23; 20 mW: t(165) = 0.97, p=0.33; 25 mW: t(165) = 0.80, p=0.43). (E) Average limb AIMs scores. A linear mixed-effects model found a significant interaction between test number and laser power in ChR2-injected rats: t(164) = 2.81, p=5.51×10⁻³. EYFP-injected rats did not display limb AIMs: t(164) = 0.00, p=1.00. ChR2-injected rats’ limb AIMs scores did not differ significantly from EYFP-injected rats’ limb AIMs scores on test day 1 (Contrast tests: 5 mW: t(164) = 1.42, p=0.16; 10 mW: t(164) = 1.55, p=0.12; 15 mW: t(164) = 1.33, p=0.19; 20 mW: t(164) = 1.08, p=0.28; 25 mW: t(164) = 0.91, p=0.37). (F) Difference between average number of contralateral and ipsilateral (relative to hemisphere implanted with optical fiber) rotations. A positive score indicates a bias toward contralateral spins and a negative score indicates a bias towards ipsilateral spins. ChR2-injected rats did not increase the number of contralateral spins between test 1 and test 2, nor did laser power affect rotational behavior. Linear mixed model: interaction between test number and laser power: t(164) = −0.39, p=0.69. EYFP-injected rats did not show a bias in either direction with laser stimulation: t(164) = 0.10, p=0.92. (*p<0.05, **p<0.01 for ChR2-injected rats). ChR2 rats had a stronger bias toward contralateral spins compared to EYFP rats at 5 mW (contrast tests: t(164) = 2.57, p=0.01), 10 (t(164) = 3.44, p=7.37×10⁻⁴), 15 (t(164) = 3.38, p=9.19×10⁻⁴), 20 mW (t(164) = 3.05, p=2.69×10⁻³), and 25 mW (t(164) = 2.77, p=6.29×10⁻³) on test day 1. ChR2 rats in panels C-F include rats from ‘ChR2 during’ (n = 5) and ‘ChR2 between’ (n = 7) groups. Figure 11—figure supplement 1 shows the relationship between AIMs scores in the cylinder and reach success rates for individual rats.


