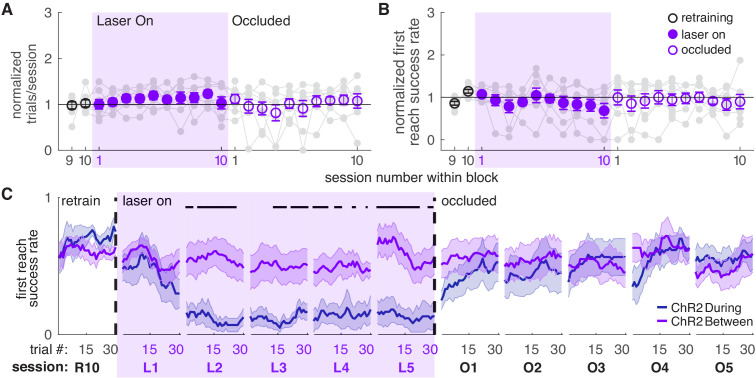
Figure 3. Dopamine neuron stimulation between reaches does not affect skilled reaching performance.
(A) Average number of trials per session divided by the baseline number of trials for ‘between reach’ stimulation. Gray lines represent individual rats. Linear mixed model: effect of laser: t(79) = 1.13, p=0.26; interaction between laser and session: t(584) = −0.64, p=0.52. (B) Average first attempt success rate divided by baseline success rate for ‘between reach’ stimulation. Linear mixed model: effect of laser: t(133) = −0.29, p=0.78; interaction between laser and session: t(584) = −0.94, p=0.35. (C) Moving average of success rate within individual sessions in the last retraining session, first 5 ‘laser on’ sessions, and first 5 ‘occlusion’ sessions. ‘R10’, ‘L1’, ‘O1’, etc. indicate the 10th retraining session, first ‘laser on’ session, first ‘occlusion’ session, etc. ‘During reach’ data from Figure 2 are shown for comparison. Unlike panel B, these are not normalized to retraining sessions because they are within-session moving averages. Black bars represent trials with a statistically significant difference between groups (Wilcoxon rank sum text, p<0.01). Data for individual rats are shown in Figure 3—figure supplement 1. Figure 3—figure supplement 2 shows additional performance measures for ‘between reach’ ChR2 activation (‘any reach’ success rates, number of attempts per trial, and breakdown of reach outcomes across sessions). Shaded colored areas in C and error bars in A-B represent s.e.m.
Figure 3—figure supplement 1. Individual rat data for moving average of success rate across trials within individual sessions (‘ChR2 Between’).
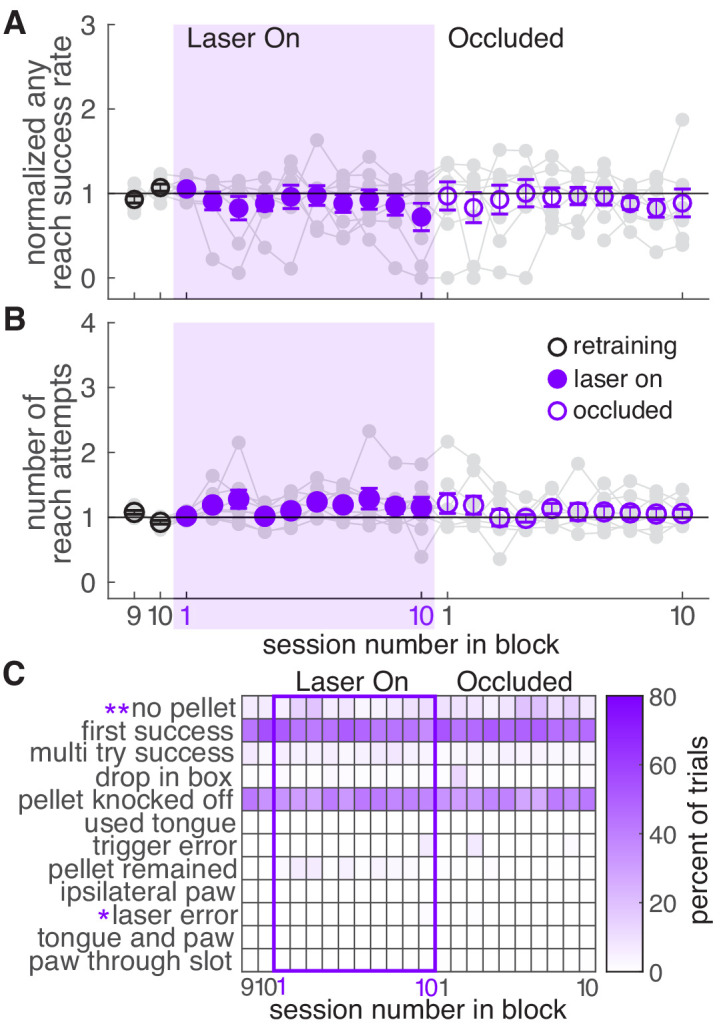
Figure 3—figure supplement 2. Additional task performance measures for ‘between reach’ ChR2 stimulation.


