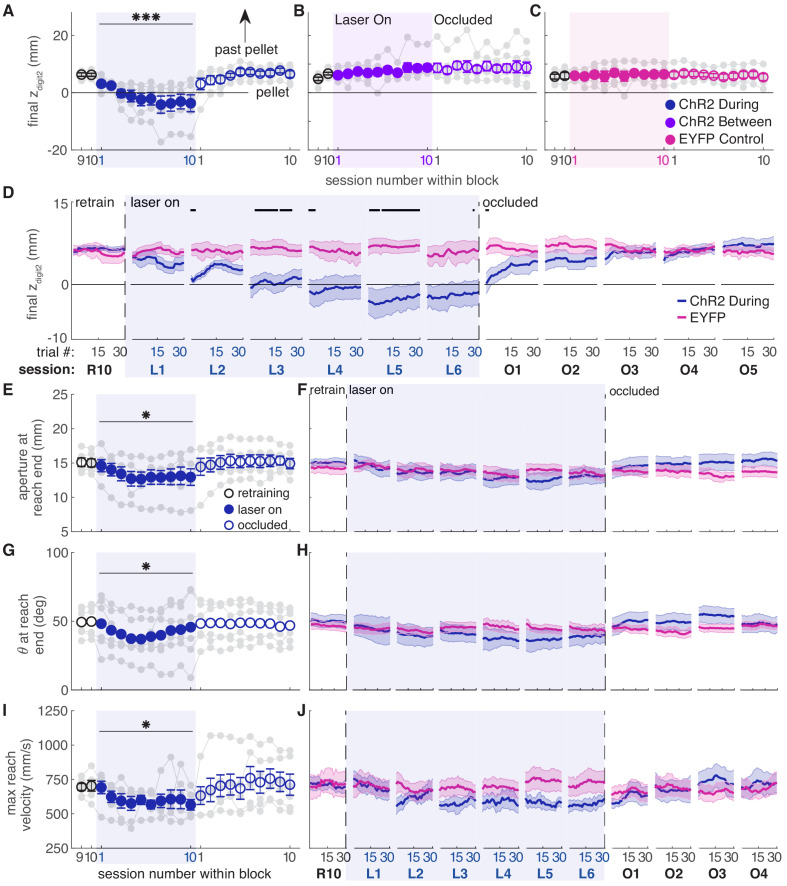
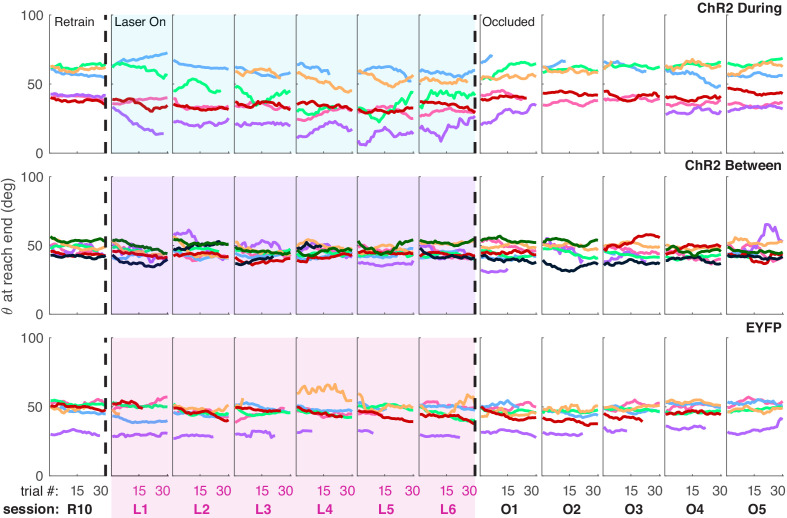
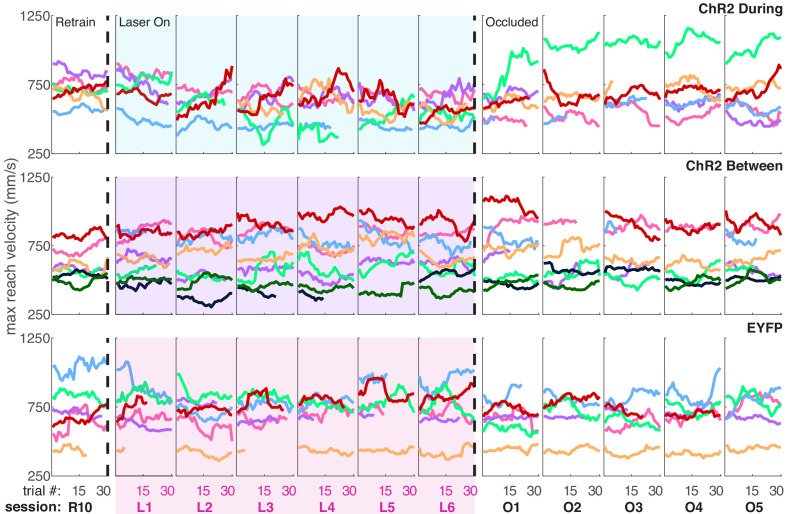
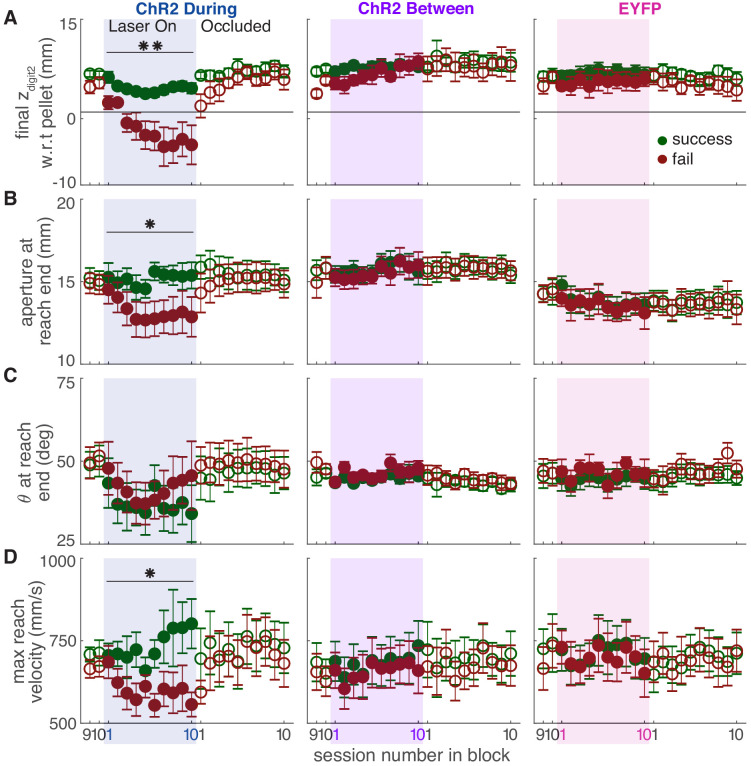
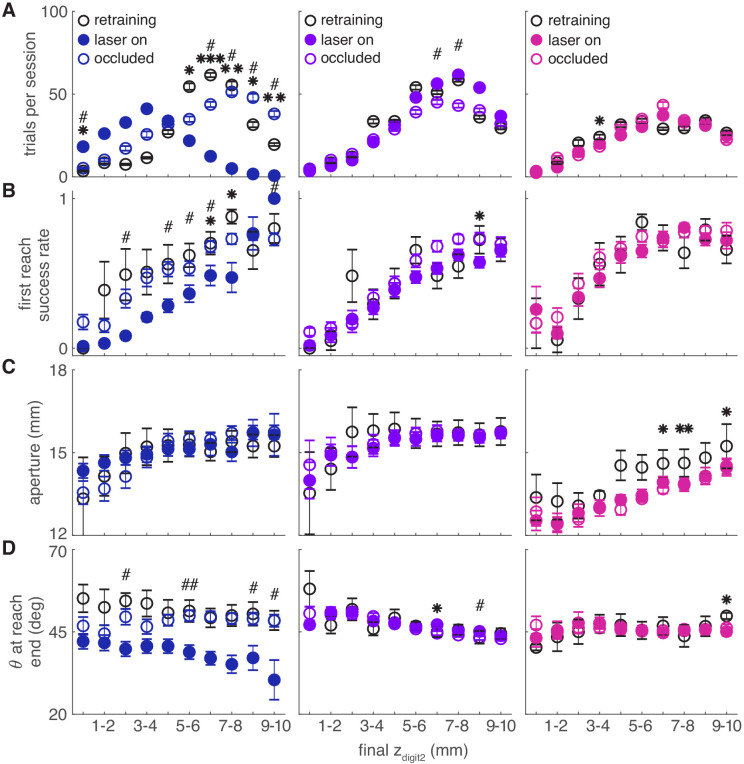
Figure 6. Dopamine neuron stimulation induces progressive changes in reach-to-grasp kinematics.
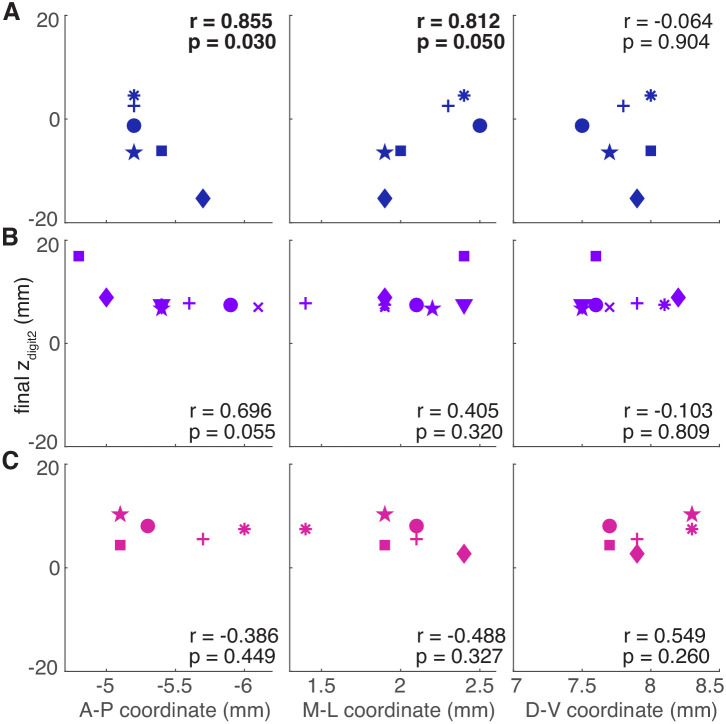
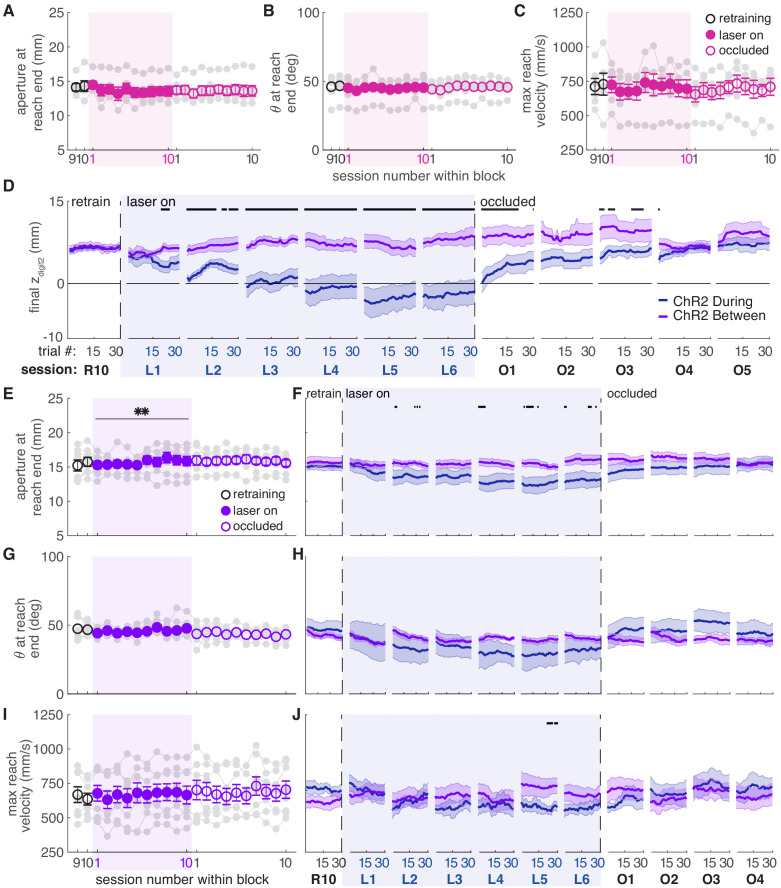
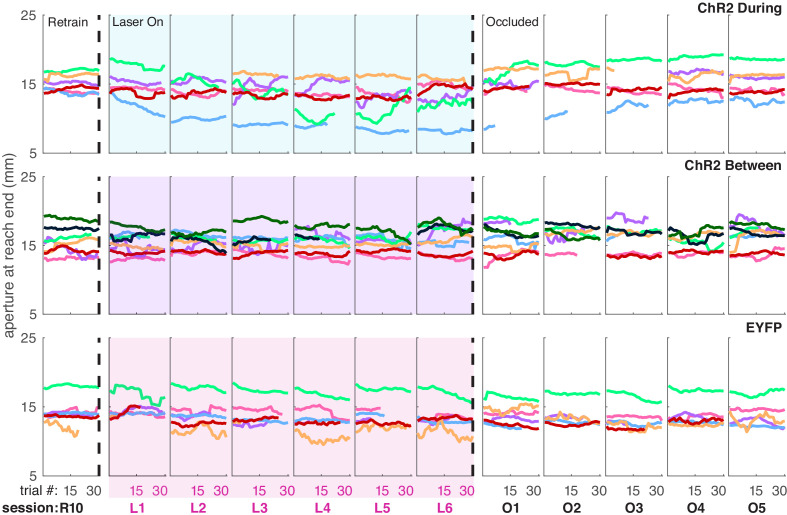
(A) The average maximum reach extent progressively decreased across sessions with ‘during reach’ stimulation. Linear mixed model: effect of laser: t(62) = 1.70, p=0.09; interaction between laser and session: t(585) = 6.88, p=1.59×10⁻¹¹. Average maximum reach extent returned to baseline within the first ‘occlusion’ session. Contrast testing (‘retraining’ session 10 vs. ‘occlusion’ session 1): t(585) = 1.62, p=0.11. (B) Same as (A) for ‘between reach’ stimulation. Linear mixed model: effect of laser: t(62) = 0.02, p=0.99; interaction between laser and session: t(585) = −0.43, p=0.67. (C) Same as (A) and (B) for ‘during reach’ illumination in control EYFP-injected rats. Linear mixed model: effect of laser: t(62) = 0.10, p=0.92; interaction between laser and session: t(585) = −0.68, p=0.50. Figure 6—figure supplement 1 shows the relationship between reach extent and fiber tip location for these groups. (D) Moving average of maximum reach extent within the last ‘retraining’ session, first 6 ‘laser on’ sessions, and first 5 ‘occlusion’ sessions. Black bars represent trials with a statistically significant difference between groups (Wilcoxon rank sum test, p<0.01). (E) Average grasp aperture at reach end for ‘during reach’ stimulation. Linear mixed model: effect of laser: t(48) = −1.34, p=0.19; interaction between laser and session: t(585) = −2.19, p=0.03. Average aperture returned to baseline within the first ‘occlusion’ session. Contrast testing (‘retraining’ session 10 vs. ‘occlusion’ session 1): t(585) = −0.87, p=0.38. (F) Moving average of aperture at reach end within the last ‘retraining’ session, first 6 ‘laser on’ sessions, and first 4 ‘occlusion’ sessions. (G) Same as (E) for paw orientation. Linear mixed model: effect of laser: t(74) = −2.52, p=0.01; interaction between laser and session: t(585) = 0.19, p=0.85. Average angle returned to baseline within the first ‘occlusion’ session. Contrast testing (‘retraining’ session 10 vs. ‘occlusion’ session 1): t(585) = 1.64, p=0.10. (H) Moving average of paw angle at reach end across trials in the last (10th) ‘retraining’ session, first 6 ‘laser on’ sessions, and first 4 ‘occlusion’ sessions. (I) Same as (E) and (G) for maximum reach velocity. Linear mixed model: effect of laser: t(49) = −0.45, p=0.65; interaction between laser and session: t(585) = −2.45, p=0.01. Average velocity returned to baseline within the first ‘occlusion’ session. Contrast testing (‘retraining’ session 10 vs. ‘occlusion’ session 1): t(585) = −1.64, p=0.10. (J) Moving average of maximum reach velocity within the last ‘retraining’ session, first 6 ‘laser on’ sessions, and first 4 ‘occlusion’ sessions. ‘R10’, ‘L1’, ‘O1’, etc. indicate the 10th retraining session, first ‘laser on’ session, first ‘occlusion’ session, etc. Shaded colored areas in D, F, H, J and error bars in A, B, C, E, I represent s.e.m. Similar data for ChR2 Between rats are shown in Figure 6—figure supplement 2. Individual rat data are shown in Figure 6—figure supplements 3–6. Figure 6—figure supplement 7 compares kinematic measures (final zdigit2, aperture, paw orientation, and maximum reach velocity) between successful and unsuccessful reaches for ChR2 during, ChR2 between, and EYFP rats. Figure 6—figure supplement 8 shows success rate and kinematic measures as a function of final zdigit2 for ChR2 during, ChR2 between, and EYFP rats. * indicates p<0.05 for the laser or laser-session interaction terms in panels E, G, I. *** indicates p<1.0×10⁻¹⁰ for the laser-session interaction term in panel A.

